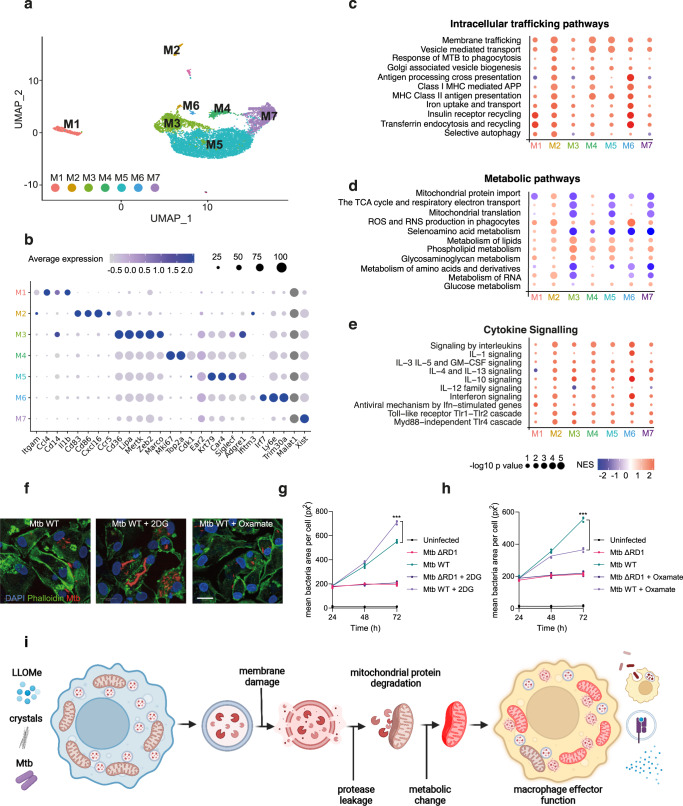
Fig. 7. Lysosomal leakage regulates metabolic and immune responses in specific subsets of macrophages in vivo.
a UMAP plot of BAL cells (n = 8723) showing seven identified macrophage clusters (M1-M7). b Dot-plot showing expression levels of representative genes for each macrophage cluster. c–e Intracellular trafficking (c), metabolic (d) and cytokine signalling (e) pathways significantly enriched by the treatment among the different macrophage populations (results show fold change vs beads). f Representative images of iPSDM infected with Mtb WT for 72 h in the presence of absence of 2-DG or oxamate. n = 3 independent experiments. g, h iPSDM were infected with Mtb ΔRD1 or Mtb WT and incubated in the presence or absence of 2-DG (g) or oxamate (h). Graphs show mean bacteria area per macrophage at 24, 48 and 72 h after infection. Data represent the mean ± SEM of three independent biological replicates. One‐way ANOVA and Tukey post-test was used for multiple comparisons, ***p ≤ 0.001. i Scheme summarising the main events leading to macrophage metabolic reprogramming after lysosomal protease leakage. Source data are provided as a Source Data file. Scale bar, 10 μm. See also Supplementary Figs. 8–9, Supplementary Table 2 and Supplementary Data 3 and 4.

