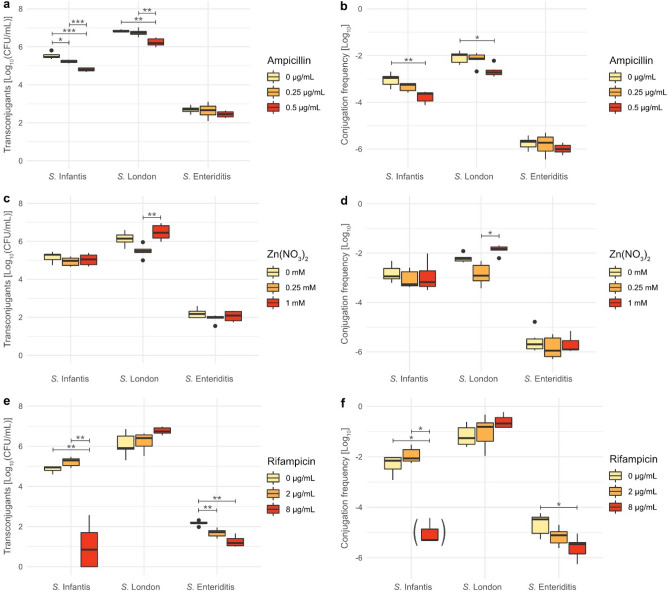
Figure 1.
Transconjugant numbers and calculated conjugation frequencies, observed at different concentrations of ampicillin (a,b), Zn(NO3)2 (c,d), and rifampicin (e,f). Pairwise comparison of transconjugant numbers and conjugation frequencies at different concentrations was perform via the Student’s T-test. P-values were adjusted using the Bonferroni correction. Significance levels: *p < 0.05, **p < 0.01, ***p < 0.001. Boxplot in brackets (f) indicates that the calculation of conjugation frequencies for some data points was omitted due to no observed transconjugants.

