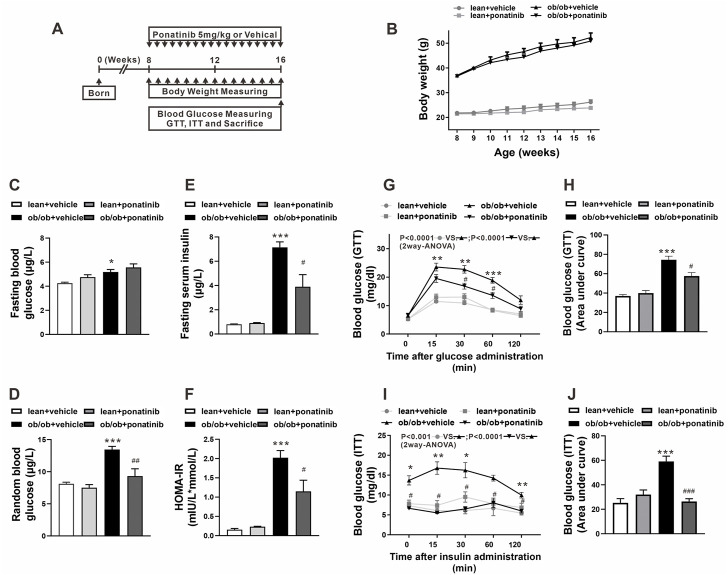
FIGURE 1.
Ponatinib improved insulin resistance in ob/ob mice (A) Schematic diagram of experimental protocol for studying the effect of ponatinib in ob/ob mice and lean mice. (B) Body weight of ob/ob mice and the lean mice after administration with or without ponatinib. n = 5. (C–F) Fasting blood glucose (C), random blood glucose (D), fasting serum insulin (E) and HOMA-IR index (F) of ob/ob and lean mice with or without ponatinib. n = 5. (G–J) GTT (G) and ITT (I) performed on ob/ob mice and lean mice after 8-week administration with or without ponatinib. Blood glucose area under the curve (H–J) measured from G and I. n = 5. Statistical comparisons were performed with RM two-way ANOVA with Bonferroni’s multiple comparisons test. (G–I) and one-way ANOVA (B–J) followed by Bonferroni’s multiple comparisons post hoc test. Data represent mean ± SEM. *p < 0.05, **p < 0.01, ***p < 0.001 vs. lean + vehicle. #p < 0.05, ##p < 0.01, ###p < 0.001 vs. ob/ob + vehicle.

