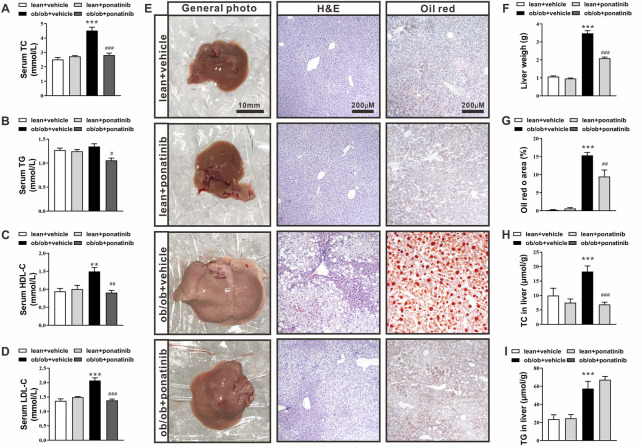
FIGURE 2.
Ponatinib improved lipid ectopic deposition in ob/ob mice (A–D) Serum TC (A), TG (B), HDL (C), LDL (D) of ob/ob mice and lean mice treated with or without ponatinib. n = 5. (E) Representative images of liver, HE and Oil Red O staining of livers tissues from ob/ob mice and lean mice with or without ponatinib. n = 5. Scale bar,10 mm, 200 μm. (F) Liver weight in ob/ob mice and control mice treated with ponatinib or vehicle. n = 5. (G) Quantification of oil red area from (E) (H–I) Liver TC (H), TG (I) levels in ob/ob mice or lean mice administrated with ponatinib or vehicle. n = 5. Statistical comparisons were performed with one-way ANOVA (A–D) (F–I) followed by Bonferroni’s multiple comparisons post hoc test. Data represent mean ± SEM. **p < 0.01, ***p < 0.001 vs. lean + vehicle. #p < 0.05, ##p < 0.01, ###p < 0.001 vs. ob/ob + vehicle.

