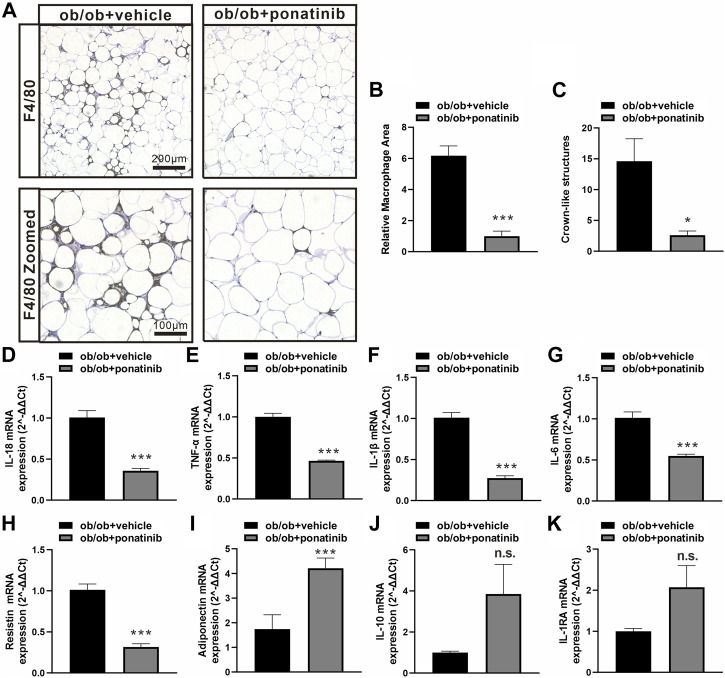
FIGURE 4.
Ponatinib inhibited macrophage infiltration and cytokine expression in adipose tissue (A) Representative image of F4/80 immunostaining of visceral adipose sections of ob/ob mice in ponatinib group and control group. n = 5. Scale bar, 100 μm and 200 μm (B) Quantification of relative macrophage from (A) n = 5 (C) Quantitative analysis of crown-like structures from (A) n = 5. (D–K) mRNA levels of gene associated with inflammatory response in visceral adipose tissue of ob/ob mice treated with ponatinib or vehicle. n = 4. Statistical comparisons were performed with unpaired two-tailed Student’s t-test (B–K). Data represent mean ± SEM. n.s. p > 0.05, * p < 0.05, *** p < 0.001 vs. ob/ob + vehicle.

