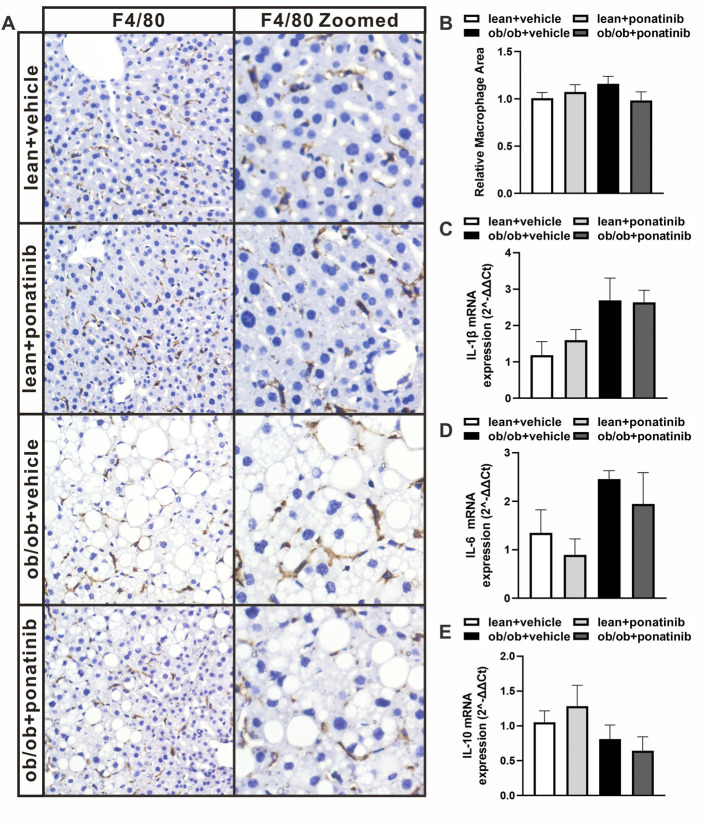
FIGURE 5.
Ob/ob mice and lean mice had similar macrophage infiltration and inflammatory factor levels in liver with or without ponatinib. (A) Representative image of F4/80 immunostaining of liver sections of ob/ob mice and lean mice administrated with ponatinib or vehicle. n = 5. (B) Relative macrophage area of each group from (A) n = 5. (C–E) IL-1β, IL-6, and IL-10 mRNA transcription from liver of ob/ob mice and lean mice treated with or without ponatinib measured by qPCR. n = 5. Statistical comparisons were performed with one-way ANOVA (B–D) followed by Bonferroni’s multiple comparisons post hoc test. Data represent mean ± SEM.

