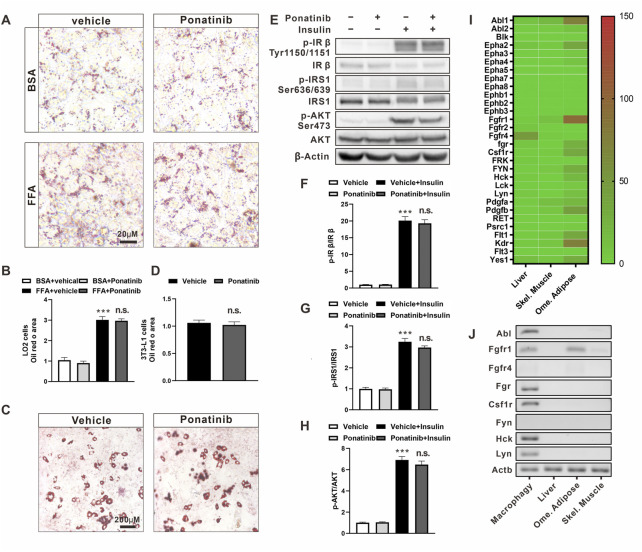
FIGURE 6.
The metabolic profile of hepatocytes and adipocytes was not directly affected by ponatinib. (A) Representative Oil Red O staining of LO2 cells administrated with ponatinib or vehicle after FFA or BSA stimulation for 24 h n = 6. Scale bar, 20 μm (B) Quantitative analysis of oil red area of LO2 cells in (A). Statistical comparisons were performed with one-way ANOVA followed by Bonferroni’s multiple comparisons post hoc test. Data represent mean ± SEM, ***p < 0.001 vs. BSA + vehical; n. s. p > 0.05 vs. FFA + Vehicle. (C) Representative Oil Red O staining of 3T3-L1 adipocytes treated with ponatinib or vehicle. n = 6. Scale bar, 200 μm (D) Quantitative analysis of oil red area of 3T3-L1 adipocytes in (C). n = 6. Statistical comparisons were performed with unpaired two-tailed Student’s t-test, Data represent mean ± SEM, n. s. p > 0.05 vs. Vehicle. (E) Representative western blot showing levels of total and phosphorylation of IR-β (Tyr1150/1151), IRS1(Ser636/639), AKT (Ser473) of 3T3-L1 adipocytes in response to insulin stimulation for 30 min with or without ponatinib treatment. n = 4. (F–H) Quantification of phosphorylation of IR-β (Tyr1150/1151), IRS1 (Ser636/639), AKT (Ser473) expression level in (E). n = 4. Statistical comparisons were performed with one-way ANOVA followed by Bonferroni’s multiple comparisons post hoc test. Data represent mean ± SEM, ***p < 0.001 vs. Vehical; n. s. p > 0.05 vs. Vehicle + Insulin. (I) The expression profile of ponatinib’s high-affinity targets in liver, skeletal muscle and omentum adipose from Genotype-Tissue Expression (GTEx) Project. Color scale indicates mean TPM (transcripts per million) value. (J) Representative electropherogram of one of six mice qPCR products to verify FGR, HCK, Lyn, CSFR, Fyn, FGFR, and ABL mRNA expression levels in BMDM, visceral fat, liver, and skeletal muscle.

