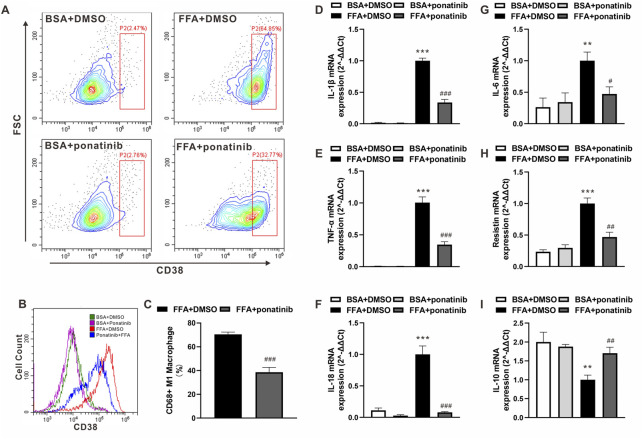
FIGURE 7.
Ponatinib attenuated FFA induced Inflammatory phenotypic transformation of macrophages. (A) Flow cytometry analysis of the distribution of CD38 in BMDM cultured with FFA or BSA after treated with ponatinib or vehicle. (B) Representative overlayed histogram in (A) (C) Analysis of CD38 positive M1 macrophage ratio after FFA treatment in (A) n = 6. (D–I) mRNA levels of gene associated with inflammatory response in FFA treated BMDMs with or without ponatinib. n = 4. Statistical comparisons were performed with unpaired two-tailed Student’s t-test (C) or one-way ANOVA (D–I) followed by Bonferroni’s multiple comparisons post hoc test. Data represent mean ± SEM, **p < 0.01, ***p < 0.001 vs. BSA + DMSO. # p < 0.05, ## p < 0.01, ### p < 0.001 vs.FFA + DMSO.

