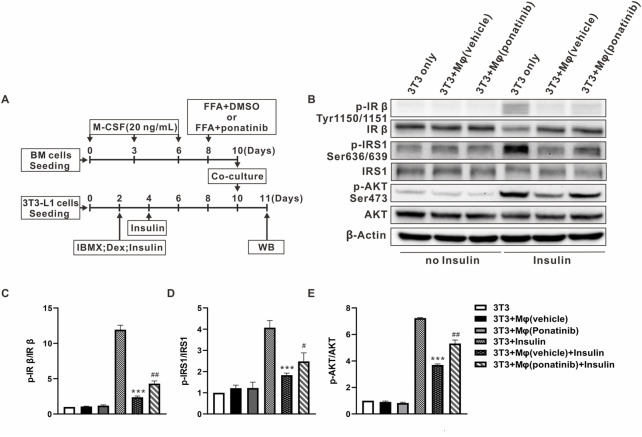
FIGURE 8.
Insulin sensitivity of adipocytes co-cultured with macrophages was protected by ponatinib. (A) Schematic diagram of experimental design for studying the effect of ponatinib in insulin sensitivity of adipocytes co-cultured with macrophages. (B) Representative western blot showing levels of total and phosphorylation of IR-β (Tyr1150/1151), IRS1(Ser636/639), AKT (Ser473) of adipocytes co-cultured with macrophages in response to insulin for 30 min with or without ponatinib treatment. n = 4. (C–E) Quantification of phosphorylation of IR-β (Tyr1150/1151), IRS1(Ser636/639), AKT (Ser473) expression level in (B) n = 4. Statistical comparisons were carried out with one-way ANOVA (C–E) followed by Bonferroni’s multiple comparisons post hoc test. Data represent mean ± SEM, ***p < 0.001 vs. 3T3+Insulin. # p < 0.05, ## p < 0.01 vs. 3T3+Mφ(vehicle)+Insulin.

