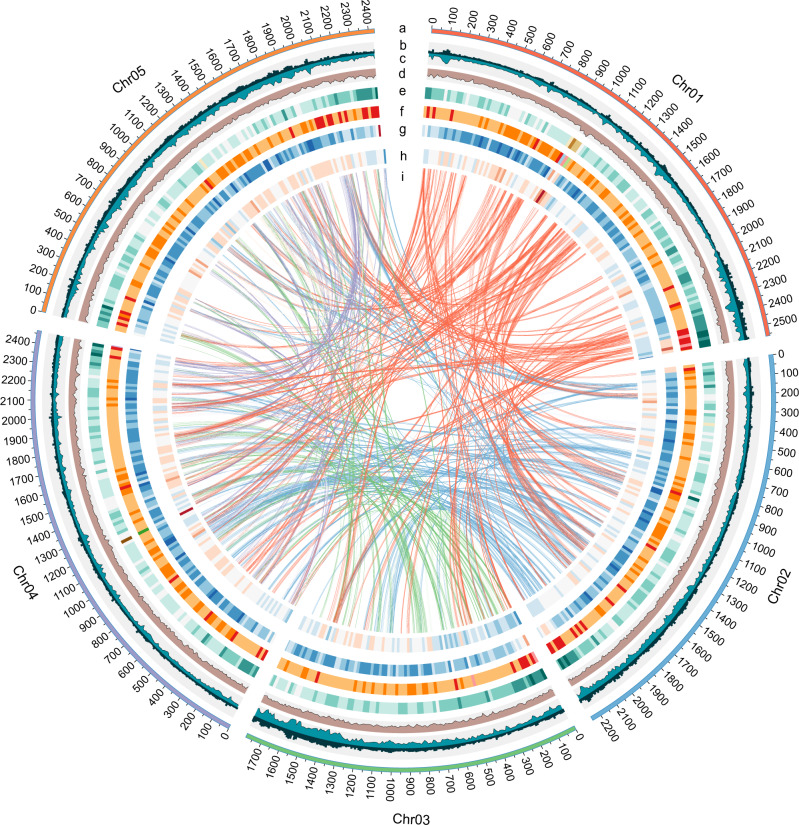
Fig. 1. Circos plot of P. ostii genomic features.
a Circular representation of the pseudomolecules. b–d The distribution of CCGG methylation density, CCWGG methylation density and H3K27me3 enrichment peak density, with densities calculated in 10 Mb windows. e–h The distribution of Copia density, Gypsy density, Del density and gene density, with densities calculated in 20 Mb windows. i Syntenic blocks. Lines represent links between synteny-selected paralogues.

