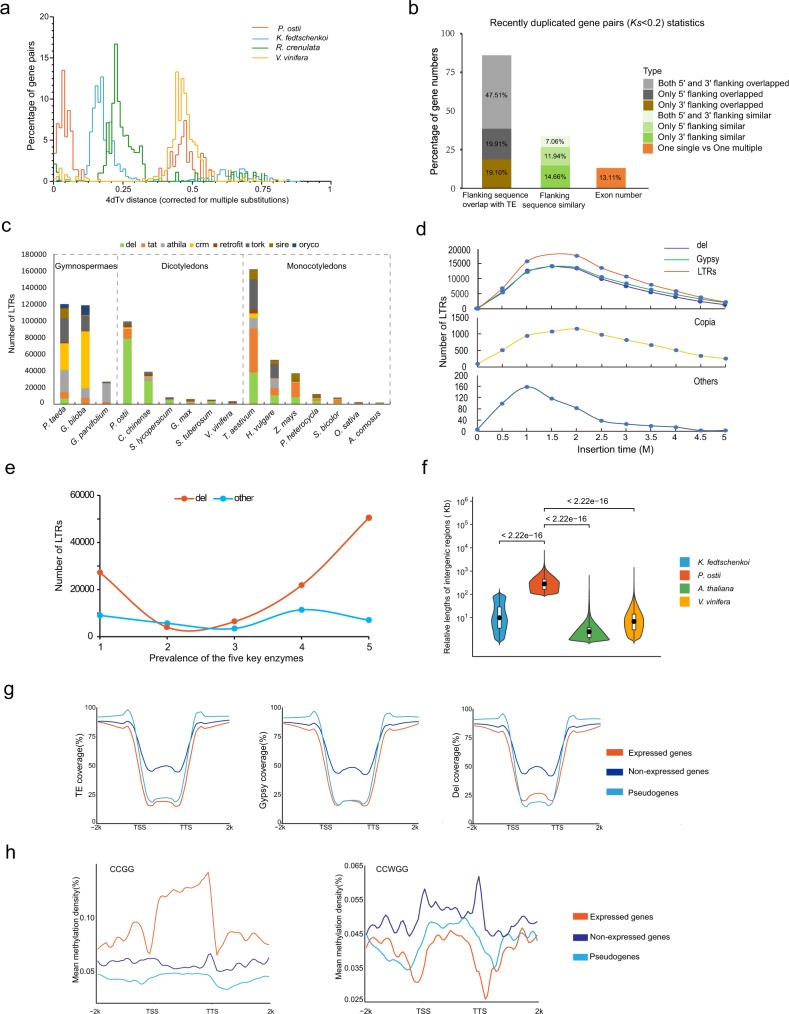
Fig. 2. Comparative genomic analysis of P. ostii.
a The distribution of 4DTv values, revealing a recent explosion of LTRs and a common γ WGD event in the P. ostii genome. b Percentage of genes with Ks <0.2 among genes with different characteristics. c Subgroups of full-length LTRs in selected Gymnospermae, dicotyledon and monocotyledon species. d Estimated insertion times of LTRs and selected subgroups in P. ostii. e Prevalence of the five key enzymes for LTRs. f Relative lengths of intergenic regions in P. ostii, A. thaliana, K. fedtschenkoi and V. vinifera. Data were presented as the mean values ± SEMs. g The distribution of TE coverage, Gypsy coverage and Del coverage in the gene region and the 2k bp external region. h Mean methylation density of CCGG and CCWGG of the expressed genes, non-expressed genes and pseudogenes in the peony intergenic regions and the 2k bp external regions. Source data are provided as a Source Data file.

