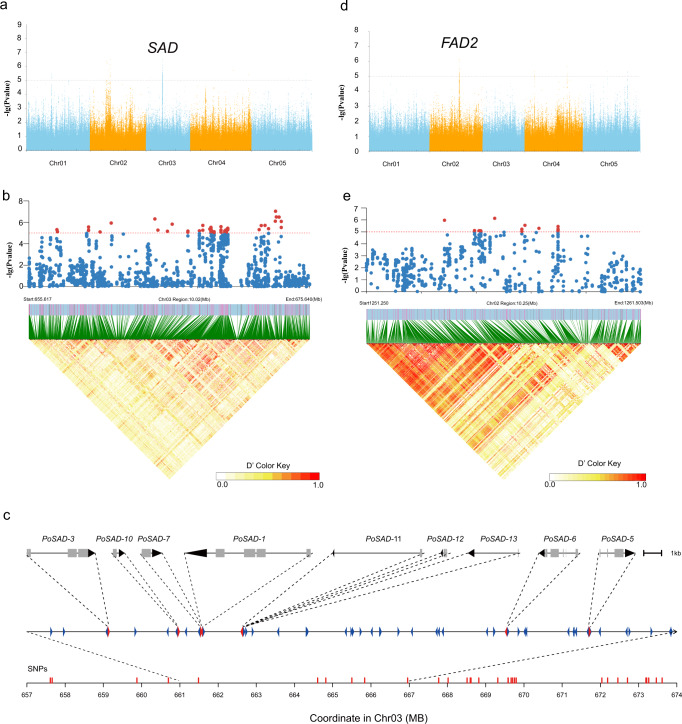
Fig. 4. GWAS of fatty acid biosynthesis-related traits in P. ostii.
a, d Manhattan plots of genome-wide association mapping results for C18:0/C18:1△9 and C18:1△9/C18:2△9,12. The positions of strong peaks that localised with the known SAD and FAD2 genes investigated in this study are indicated. b, e Local Manhattan plot (top) and LD heatmap (bottom) surrounding the peak on chromosomes 3 and 2. c A cluster of nine SAD genes within a short region of chromosome 3. Source data are provided as a Source Data file.

