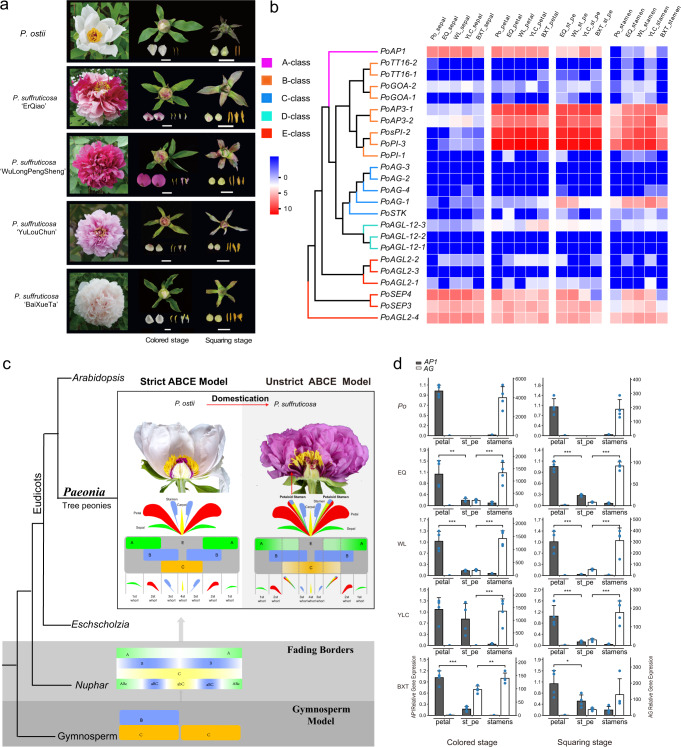
Fig. 6. Flower diversity and the development of petaloid stamen in tree peonies.
a Flowers of the tree peony P. ostii and four cultivars of P. suffruticosa (from top to bottom: ‘ErQiao’, ‘WuLongPengSheng’, ‘YuLouChun’ and ‘BaiXueTa’) at the blooming, coloured, and squaring stages, respectively (from left to right). Scale bars, 1 cm. b Heatmap of the subgroup expansion and expression patterns of flower development-related genes at the coloured stage and squaring stage. Po P. ostii, EQ ‘ErQiao’, WL ‘WuLongPengSheng’, YLC ‘YuLouChun’, BXT ‘BaiXueTa’, st_pe petaloid stamen. The colour of the scale bars represents relative expression. c Schematic diagram of the ABCE model in P. ostii and P. suffruticosa. d Relative expression of the AP1 gene (class A) and AG gene (class C) in petals, petaloid stamens, and stamens measured by real-time quantitative PCR. Four replicates for each gene were performed. Data were presented as the mean values ± SEMs. Source data are provided as a Source Data file.

