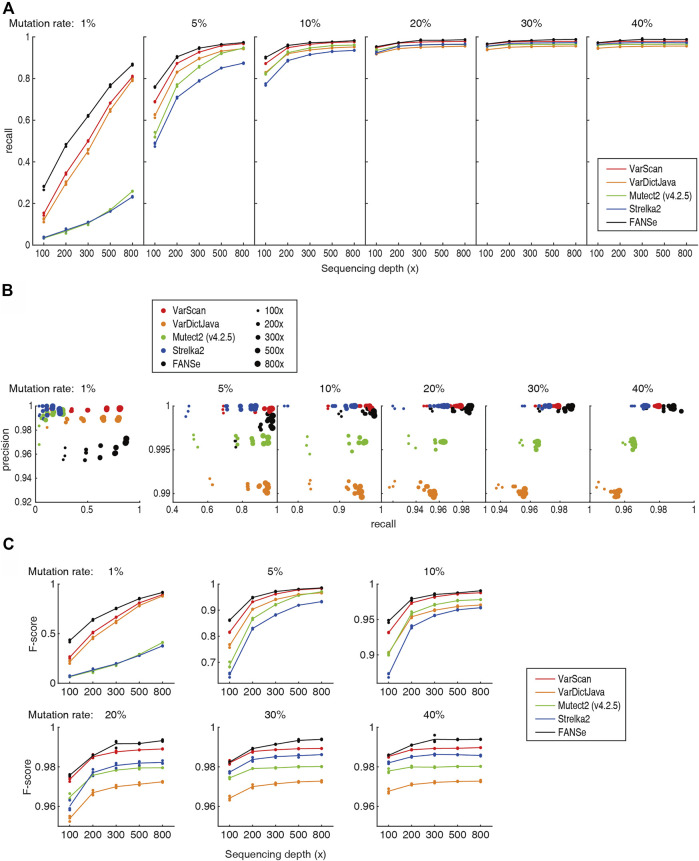
FIGURE 3.
Accuracy of the 5 pipelines. All detailed numbers are listed in Supplementary Table S1. (A) The recall rate of the 5 pipelines at different sequencing depths and mutation rates. For each mutation rate and sequencing depth, the data points for the 3 datasets were all shown, and the lines illustrate their mean values. (B) The precision-recall diagram of the 5 pipelines. Color indicates the pipeline, and the dot size indicates the sequencing depths. (C) The F-scores of the 5 pipelines.

