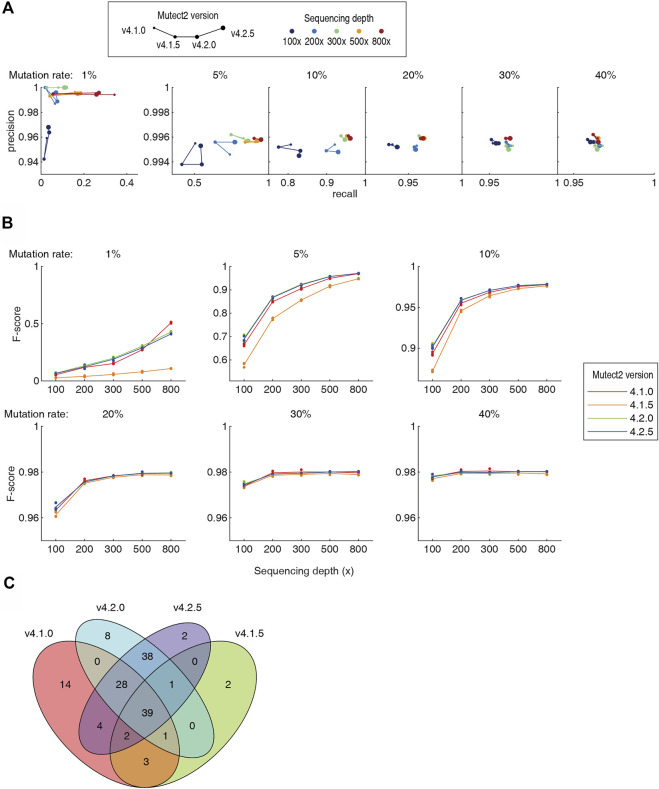
FIGURE 4.
Comparison of four versions of the Mutect2. Detailed numbers were listed in Supplementary Table S1. (A) The precision-recall diagram of Mutect2 v4.1.0 to v4.2.5. The size of dots indicates the version, and the color indicates the sequencing depths. For each sequencing depth and each mutation rate, only one dataset was chosen to make the diagram for visibility. (B) The F-scores of the four versions of the Mutect2. (C) The Venn diagram of the somatic mutations detected by four versions of the Mutect2.

