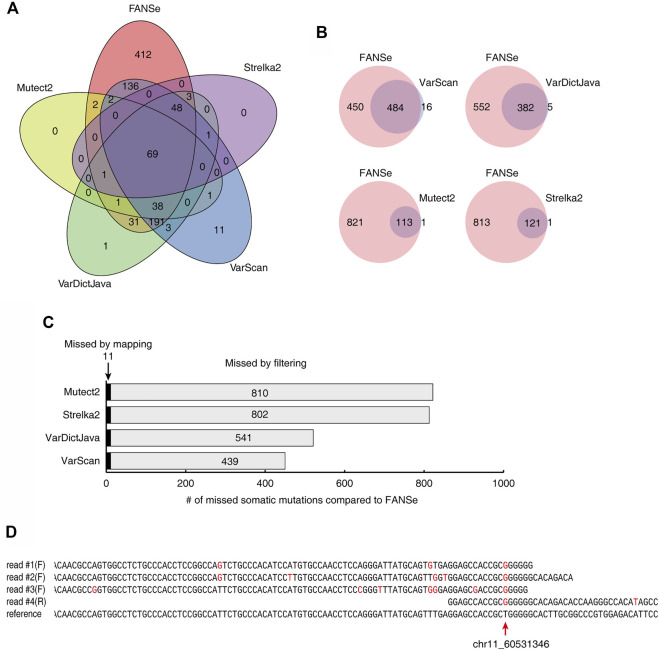
FIGURE 5.
Comparison of the somatic mutations identified by 5 pipelines on the dataset #1 of 1% mutation rate, 100x sequencing depth. (A) The Venn diagram of the somatic mutations identified by the 5 pipelines. (B) The somatic mutations identified by FANSe pipeline and the other pipelines, respectively. (C) The reason of the missed mutations by the other 4 pipelines compared to FANSe. (D) An example of mutation site (chr11, position 60531346), where the mismatch-containing reads were not mapped by BWA-MEM. Four mismatch-containing reads were mapped by FANSe and piled on the reference sequence. The read #1∼#3 were mapped to the forward strand and the read #4 was mapped to the reverse strand (illustrated as reverse-complement). Red bases illustrated the mismatches against the reference sequences.

