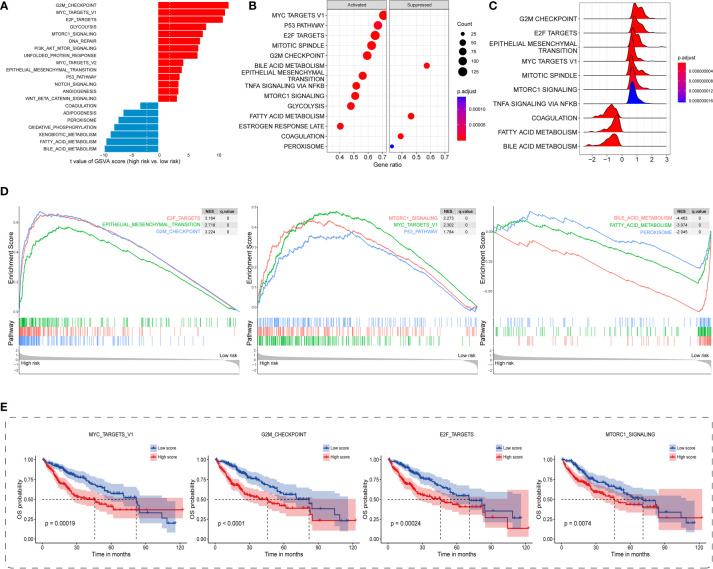
Figure 6.
Distinct carcinogenetic mechanisms between TIS-high and TIS-low groups. (A) Bar graph for the differential enrichment in carcinogenetic pathways, determined by GSVA, between the TIS-high and TIS-low groups. Bubble plot (B) and ridge plot (C) for the differential enrichment in carcinogenetic pathways, determined by GSEA, between the TIS-high and TIS-low groups. (D) GSEA enrichment plots showing significantly enriched pathways including six upregulated and three downregulated pathways. (E) KM plots of OS delineating the prognostic landscapes of the four typical oncogenic pathways. GSVA, gene set variation analysis; GSEA, gene set enrichment analysis.

