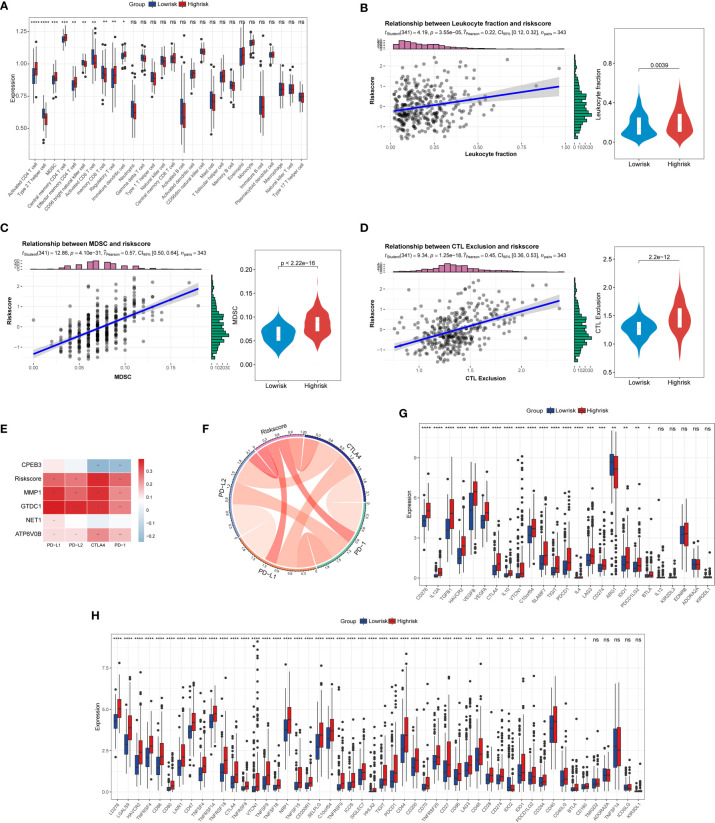
Figure 7.
Correlation of TIS with immune infiltration, immune checkpoint genes, and immunomodulatory genes. (A) The boxplot for the alteration of 28 immune cells between the TIS-high and TIS-low groups. Differential leukocyte fraction (B), MDSC (C), and CTL exclusion score (D) between the TIS-high and TIS-low groups. Heatmap (E) and chordal graph (F) for the correlation of the common immune checkpoint genes, including PD1, CTLA4, PD-L1, and PD-L2, with TIS and TIS genes. The correlation of TIS with 25 immune checkpoint genes (G) and 50 immunomodulatory genes (H); *P < 0.05; **P < 0.01; ***P < 0.001;****P < 0.0001; ns, no significance.

