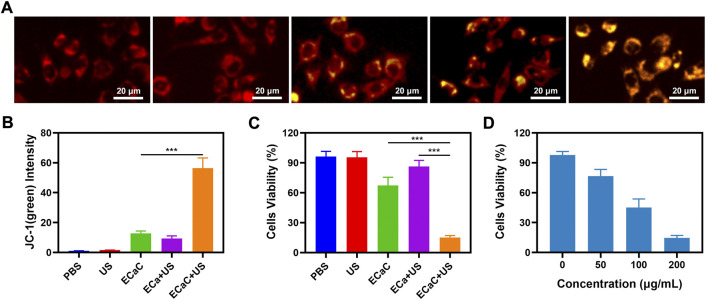
FIGURE 3.
(A) JC-1 (green) for JC-1 monomer and red for JC-1 aggregate fluorescence image under different treatment. (B) Relative JC-1 (green) intensity in 3A. (C) The survival of CT26 cells with Control, United States, ECaC, United States + ECa and United States + ECaC detected by MTT assay. (D) The survival of CT26 cells with different ECaC concentration under United States detected by MTT assay. ***p < 0.001; Student t-test.

