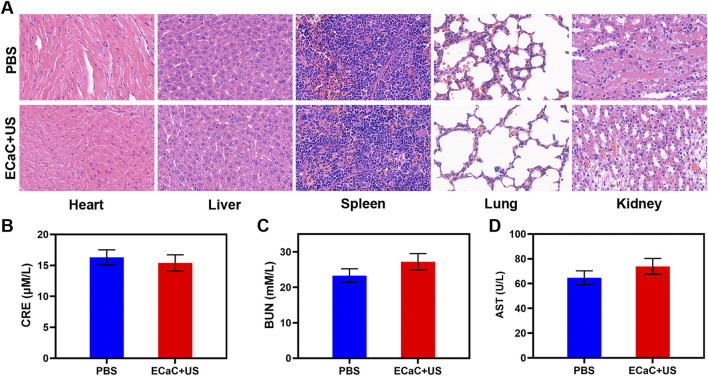
FIGURE 5.
(A) Histopathological analysis results (H&E stained images) of the major organs, heart, lung, liver, kidneys, and spleen, of mice that were exposed to different treatments 16 days post-injection. Scale bars: 100 μm. (B–D) Liver, kidney and blood function markers: AST, CRE and BUN after various treatments.

