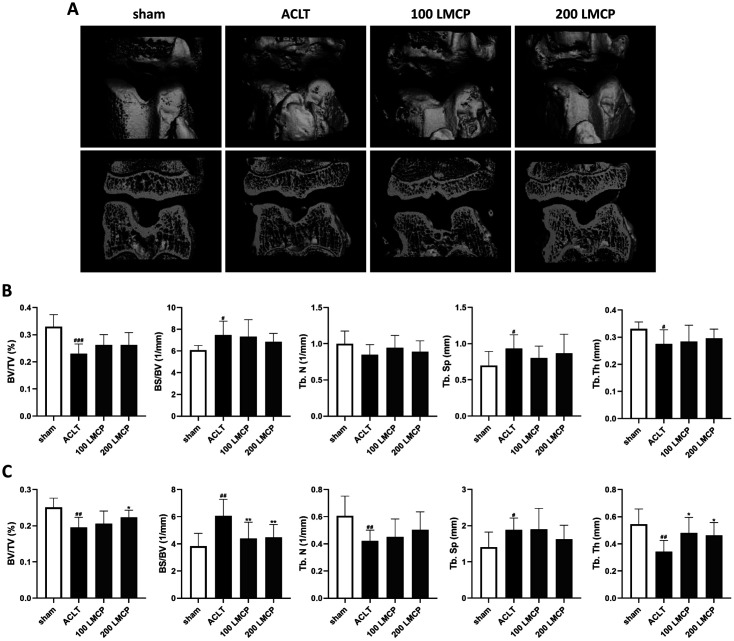
Fig. 2. Low-molecular-weight collagen peptide (LMCP) inhibited subchondral bone damage associated with osteoarthritis in the rabbit anterior cruciate ligament transection (ACLT) model.
Rabbits underwent ACLT or sham operation and received treatment with vehicle or LMCP at 100 (100 LMCP) or 200 mg/kg (200 LMCP) by oral gavage once daily for 12 weeks. (A) Representative micro-computed tomography (CT) images of subchondral bone. Quantitative micro-CT analysis of femoral (B) and tibial (C) subchondral bone. BV/TV, trabecular bone volume per total volume; BS/BV, trabecular bone surface per bone volume; TbN, trabecular number; TbSp, trabecular separation; TbTh, trabecular thickness. Data are presented as the mean ± SD (n = 8), and were analyzed via one-way analysis of variance followed by Duncan’s test. #p < 0.05, ##p < 0.01, and ###p < 0.001 compared with the sham group. *p < 0.05 and **p < 0.01 compared with the ACLT group.

