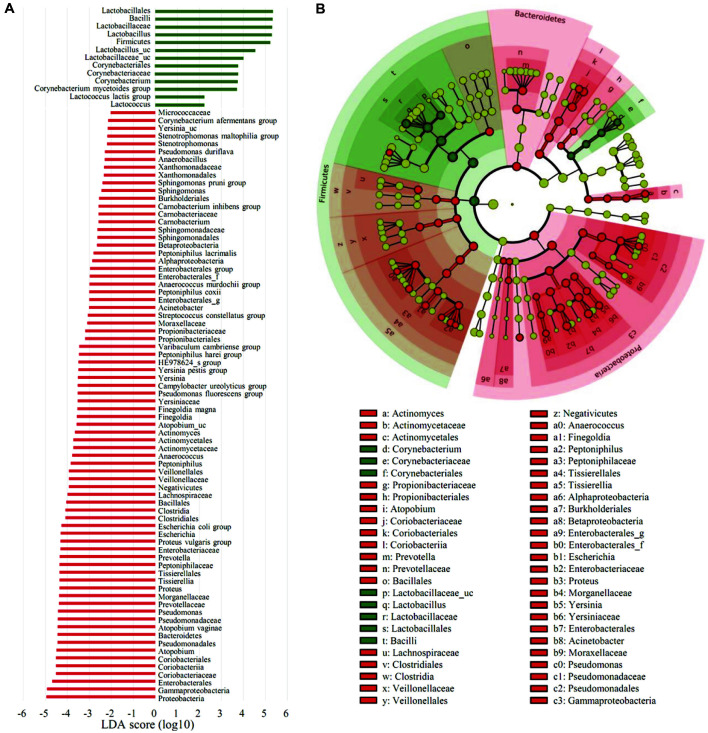
Fig. 6. Distinct taxa identified in the pre-menopause group (PRE) and post-menopause group (POST) using LEfSe (Linear discriminant analysis Effect Size) analysis.
(A) Taxonomic cladograms were derived from a LEfSe analysis with linear discriminant analysis (LDA) scores greater than 2 and significance at α < 0.05, as determined by the Kruskal-Wallis test. (B) Cladogram representing statistically significant differences in bacterial clades between premenopausal and post-menopausal women. Small circles shaded with different colors in the diagram represent the abundances of the taxa in each respective group. Each circle's diameter is proportional to the taxon's abundance. Regions in red indicate taxa enriched in the post-menopause group, while regions in green indicate taxa enriched in the pre-menopause group.

