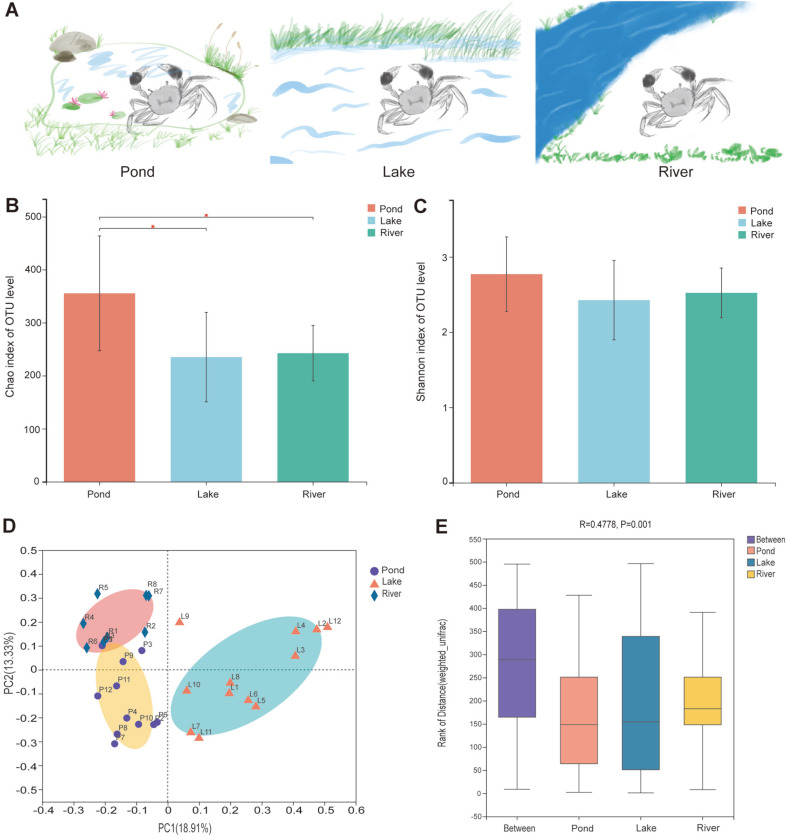
Fig. 1. Alpha and beta diversity analyses of the gut microbiota in the three environmental groups.
(A) Three diverse environments that E. sinensis inhabits; (B) Alpha diversity (Chao index) estimate at the OTU level in the three environmental groups, * indicate p <0.05 for statistical analysis; (C) Alpha diversity (Shannon index) estimate at the OTU level in the three environmental groups; (D) Beta diversity (PCoA) estimates for the bacterial communities in the three environmental groups; and (E) Beta diversity (ANOSIM) estimate in the three environmental groups.

