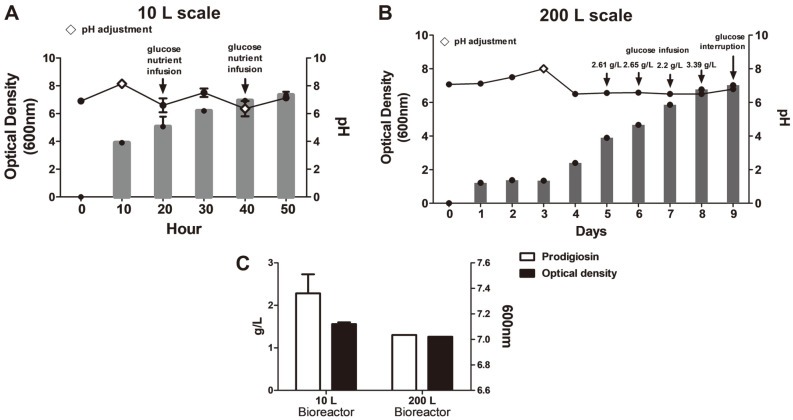
Fig. 3. Growth of H. chejuensis and changes in culture pH during prodigiosin production using optimally designed medium in the scaled-up condition.
The bar graph shows growth from OD600 readings, and the line graph shows the pH change in small-scale 10 L (A) and large-scale 200 L (B) cultures. The lozenge symbol (◇) indicates pH adjustments. Glucose injection or interruption of glucose injection is indicated at each point. (C) Prodigiosin production in 10 L and 200 L bioreactor systems for different periods of time at nearly the same optical density.

