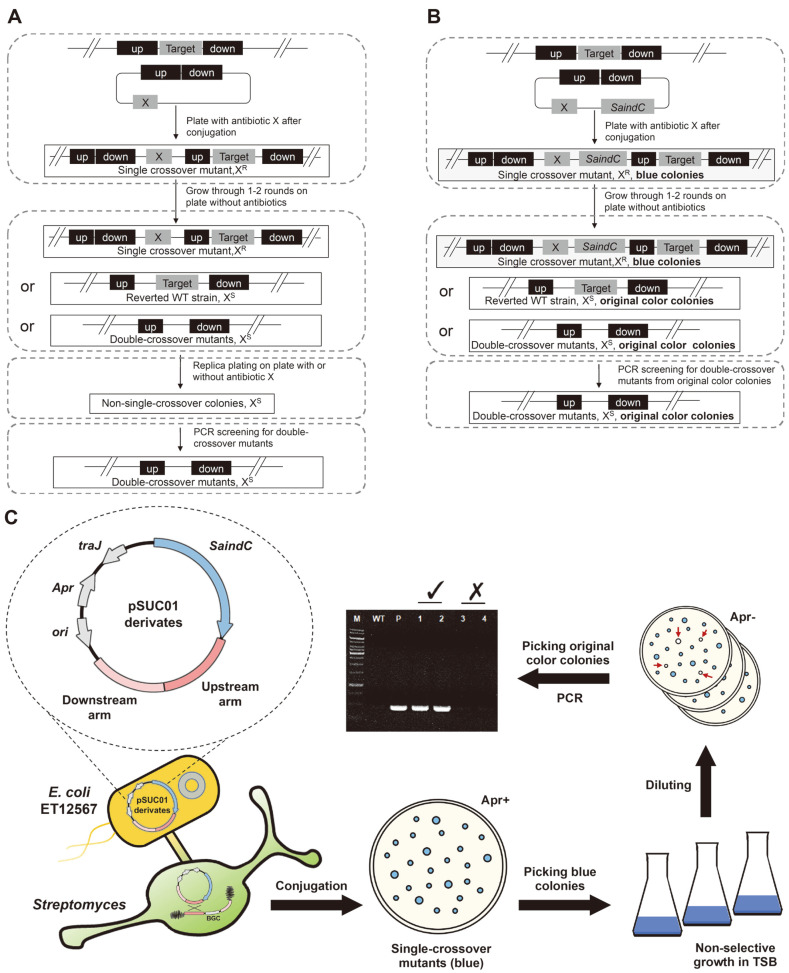
Fig. 2. Schematic diagram of the DNA fragment deletion process.
Comparison of the the classical (A) and the SaindC-based (B) deletion process in Streptomyces. X, resistance gene cassette for antibiotic X; up, the upstream homologous arm of the target DNA fragment; and down, the downstream homologous arm of the target DNA fragment. (C) The flow of SaindC-based deletion process. Apr+, plates with apramycin added; Apr-, plates without apramycin added; original color colonies are indicated with red arrows.

