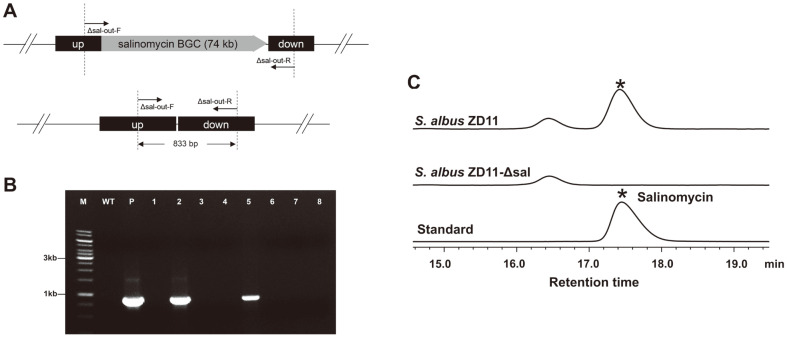
Fig. 5. Deletion of the salinomycin BGC in S. albus ZD11.
(A) The schematic diagram of the double-crossover mutants. Up, the upstream fragment of the target BGC; down, the downstream fragment of the target BGC. The primer pair Δsal-out-F/Δsal-out-R was used for PCR verification. (B) PCR verification of S. albus ZD11-Δsal. Lane M, DNA marker; lane WT, wild-type S. albus ZD11; lane P, pSUC04; lane 2 and lane 5, double-crossover mutants; lane 1, 3, 4, 6, 7, 8, reverted wild-type colonies. (C) The salinomycin production was detected using HPLC at 120 h.

