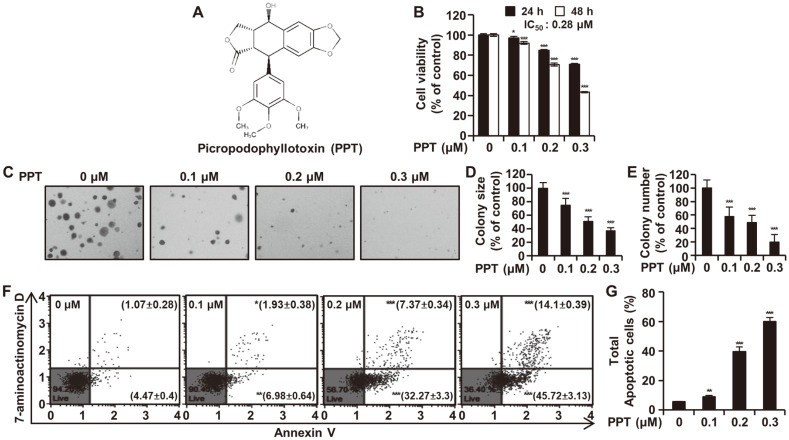
Fig. 1. Effects of PPT on Cell Proliferation and Apoptosis in HCT116 Cells.
(A) Chemical structure of picropodophyllotoxin. (B) HCT116 cells were treated with various concentrations of PPT for 24 and 48 h. Cell viability was detected by the MTT assay. (C-E) HCT116 cells were plated in soft agar containing DMSO (control) and PPT (0.1, 0.2, and 0.3 μM) for 7 days. Colony number and size were analyzed and expressed relative to the DMSO-treated control value. (F and G) HCT116 cells were incubated with the indicated concentrations of PPT for 48 h and analyzed by the Muse cell Analyzer using the Muse Annexin V & Dead Cell Kit. Live cells (annexin-V negative/7-AAD negative) are on the bottom left side, early apoptotic cells (annexin-V positive/7-AAD negative) on the bottom right side, late apoptotic cells (annexin-V positive/7-AAD positive) on the top right side and necrotic cells (annexin-V negative/7-AAD positive) on the top left side. The data are expressed as the mean ± SD (n = 3). *p < 0.05, **p < 0.01, and ***p < 0.001 compared to the control group.

