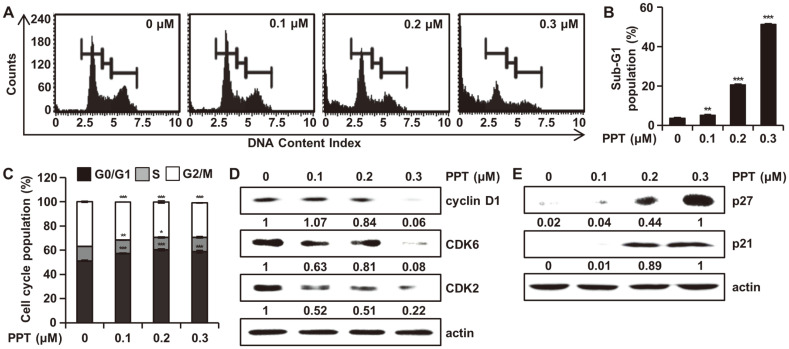
Fig. 2. Effect of PPT on Cell Cycle Distribution in HCT116 Cells.
(A, B, and C) HCT116 cells were treated with DMSO and PPT (0.1, 0.2, and 0.3 μM) for 48h. Cell cycle progression was assessed by the Muse Cell Analyzer. The mean ± SD of three independent measurements each with ratios from triplicates. *p < 0.05, **p < 0.01, and ***p < 0.001 compared to untreated group. (D and E) Cell lysates were prepared and analyzed by Western blotting for cyclin D1, CDK6, CDK2, p21, and p27. Actin was used as the denominator to quantify relative protein expression levels.

