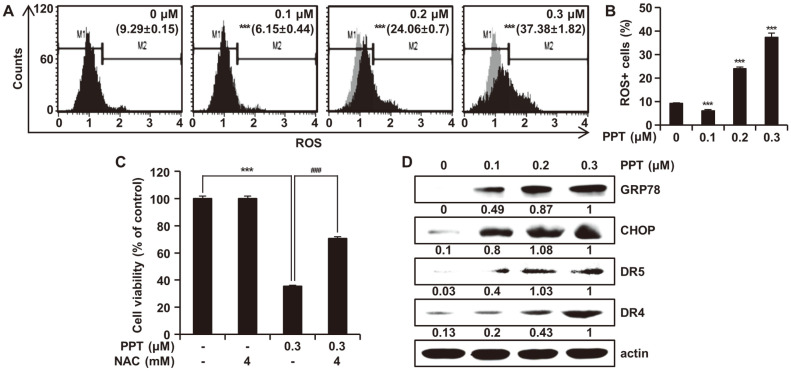
Fig. 3. Effects of PPT on ROS Generation and ER Stress.
(A and B) HCT116 cells were treated with 0, 0.1, 0.2, and 0.3 μM of PPT for 48 h and then analyzed for the level of cellular ROS using the Muse Oxidative Stress Kit. M1 represents cell population without ROS (ROS-) and M2 indicates the cell population with ROS (ROS+). (C) HCT116 cells were pretreated with NAC for 3 h and then treated with different concentrations of PPT for 48 h. Cell viability was measured by the MTT assay. The values are representative of the mean ±SD of three independent triplicate experiments. ***p < 0.001 compared to controls; ###p < 0.001 compared to PPT-treated cells. (D) HCT116 cells were treated with PPT at varying concentrations for 48 h, and the cell lysates were analyzed by Western blot for protein levels of GRP78, CHOP, DR5, and DR4. Actin was used as a loading control.

