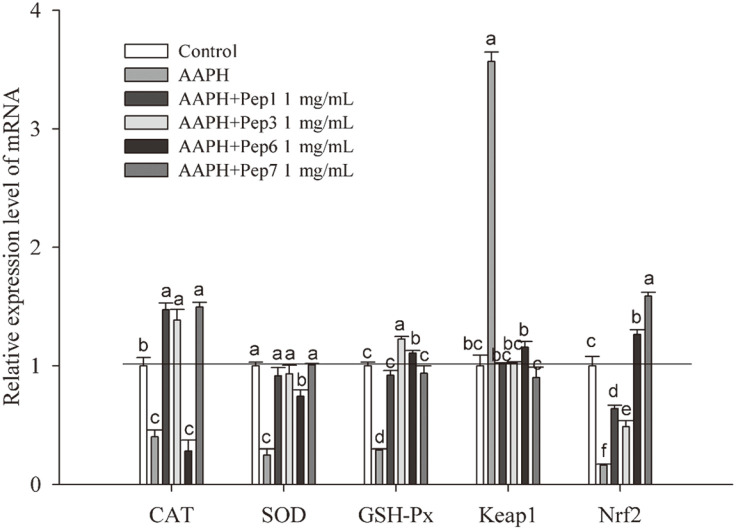
Fig. 5. The relative mRNA expression level of CAT, SOD, GSH-Px, Keap1, and Nrf2.
Each mRNA expression was normalized to that of the ribosomal protein GAPDH and expressed relative to the control level. Data are expressed as mean ± SD, and results marked with the same letters are not significantly different (p > 0.05).

