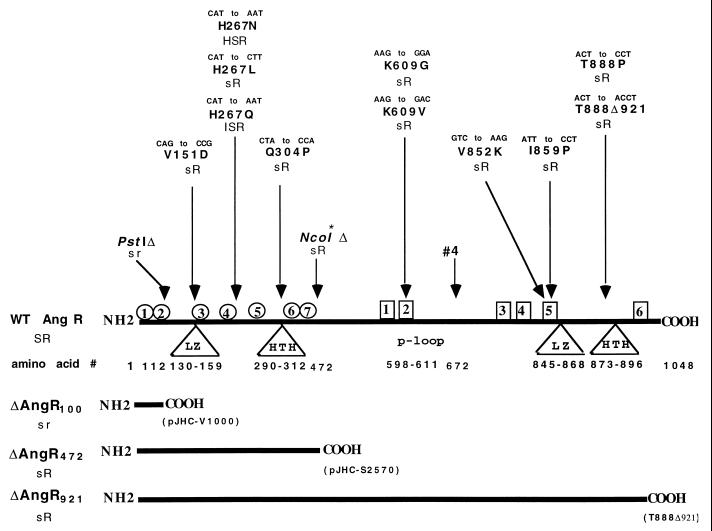
FIG. 3.
Location of mutations, modifications, and deletions on the angR gene and their phenotypes. Linear representation illustrates the regions of site-specific mutations, deletions, restriction site modification (NcoI*, with arrow), or transposon insertion (“#4”, with arrow). The mutations at the DNA level and the corresponding change in the amino acid at the protein level are indicated for each mutation. Triangles indicate that the region has structures that are predicted to be involved in regulation. The amino acids corresponding to the predicted domain are numbered below the triangle. LZ, predicted leucine zipper; HTH, predicted helix-turn-helix; p-loop, predicted ATP binding site. Circles represent the seven signature sequences (Cy1 to Cy7) corresponding to the highly conserved cyclization sequences identified in bacitracin synthetase BA1:1-2 from B. licheniformis, the proteins HMWP2-1 and HMWP2-2 from Y. enterocolitica, and the MTCY22H8.02 protein from M. tuberculosis. Amino acid numbers for each cyclization sequence are as follows: Cy1, 15 to 45; Cy2, 62 to 69; Cy3, 205 to 216; Cy4, 248 to 264; Cy5, 287 to 296; Cy6, 348 to 354; and Cy7, 365 to 391. Squares indicate regions where the core motifs found in nonribosomal peptide synthetases are located. Amino acid numbers for each core are as follows: core 1, 525 to 534; core 2, 598 to 611; core 3, 795 to 809; core 4, 838 to 842; core 5, 850 to 865; and core 6, 992 to 1002. The solid horizontal bars at the bottom show the protein molecules for the PstI deletion (ΔAngR100), the NcoI modification (ΔAngR472), and the truncation mutation T888Δ921 (ΔAngR921). Phenotypes are as follows: HS, high siderophore production (531A type); S, normal siderophore production (775 type); s, low or no siderophore production; IS, intermediate siderophore production; R, positive for iron transport gene regulation; r, reduced or no iron transport gene regulation.

