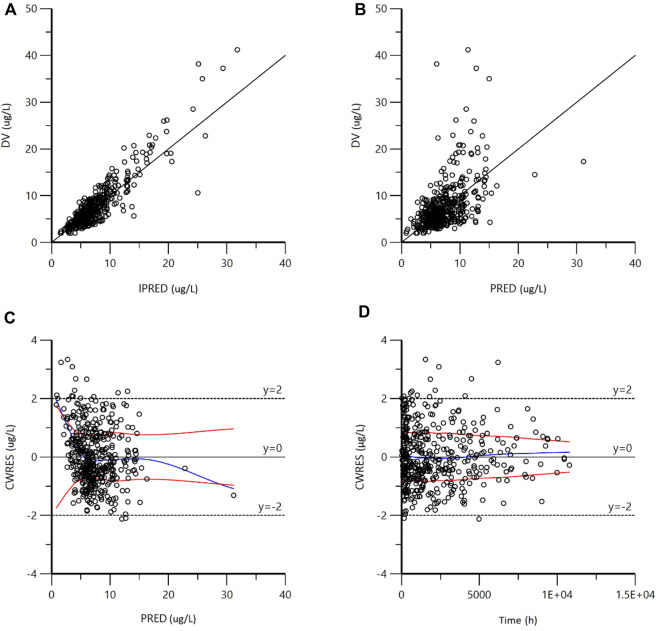
FIGURE 2.
Goodness-of-fit plots for the final model. (A) Observed concentrations (DV) vs. individual predictions (IPRED); (B) DV vs. population predictions (PRED); (C) conditional weighted residuals (CWRES) vs. PRED; (D) CWRES vs. Time). As shown in figures (A,B), the scatter points generated by the final model are evenly distributed on both sides of the reference line; as shown in figures C and D, the residual scatter points are symmetrically distributed. Most of them are in the range of (−2 ∼ + 2), which proves that there is no obvious bias in the prediction error.

