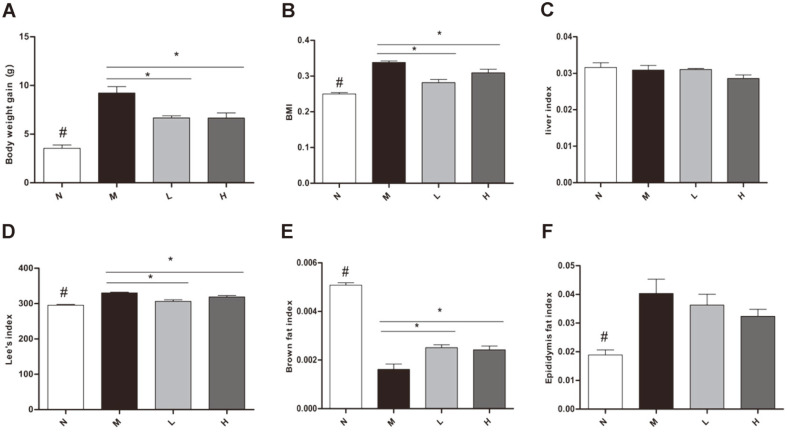
Fig. 2. Effect of LCBE in body weight gain, BMI, Lee’s index, liver index, epididymal fat index and brown fat index.
(A) Body weight gain. (B) Body mass index (BMI). (C) Liver index. (D) Lee’s index. (E) Brown fat index. (F) Epididymal fat index. N, normal group; M, model group; L, low-dose group; H, high-dose group. #p < 0.05 the N vs. the M group, *p < 0.05 vs. the M group. #p < 0.05 the N vs. the M group, *p < 0.05 vs. the M group.

