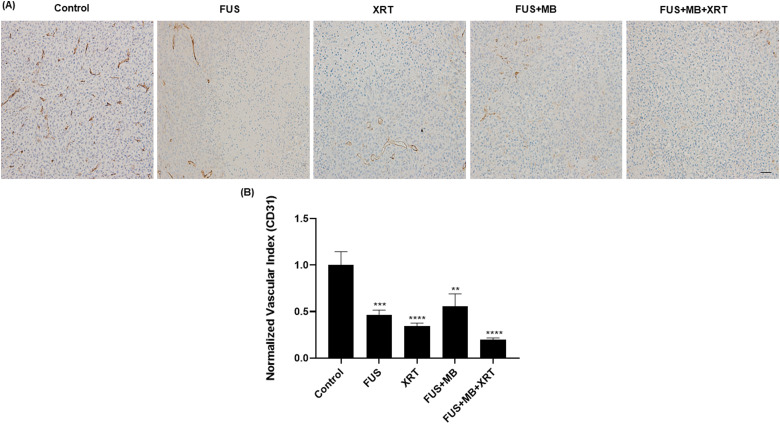
Figure 4.
CD31 labeling of MDA-MB-231 xenograft tumors sections. (A) High magnification (acquired at 10×) images of a cluster of differentiation 31 (CD31)-stained slides. The scale bar represents 50 µm (B) Normalized vascular index obtained from CD31 analysis following different treatments. Error bars represent the standard error of the mean. N = 5 animals per condition.

