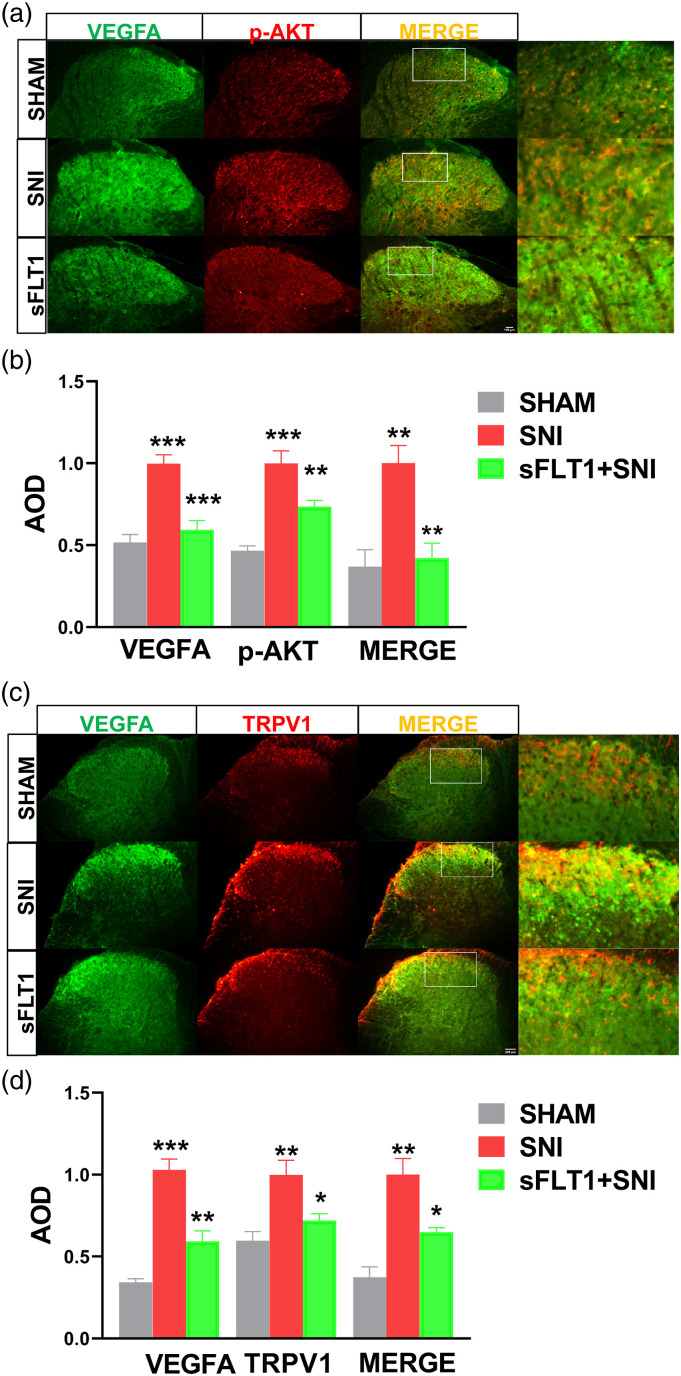
Figure 4.
Immunofluorescence analyses the expression of VEGFA, p-AKT, and TRPV1 in the spinal cord. (a–d). VEGFA (green), p-AKT (red), and TRPV1(red) are mainly expressed in the superficial dorsal horn region (laminae I-II) of the spinal cord. The expression of VEGFA, p-AKT, and TRPV1 was robustly increased in SNI mice, but sFlt1 inhibited this increase (green, b and d). The average optical densities (AODs) in the images were quantified by ImageJ. The data are shown as the mean ± SEM (n = 3). The results were analyzed by One-way ANOVA and by multiple comparisons. ⁎ p < .05, ⁎⁎ p < .01, and ⁎⁎⁎ p < .001. TRPV1, transient receptor potential vanilloid type 1.

