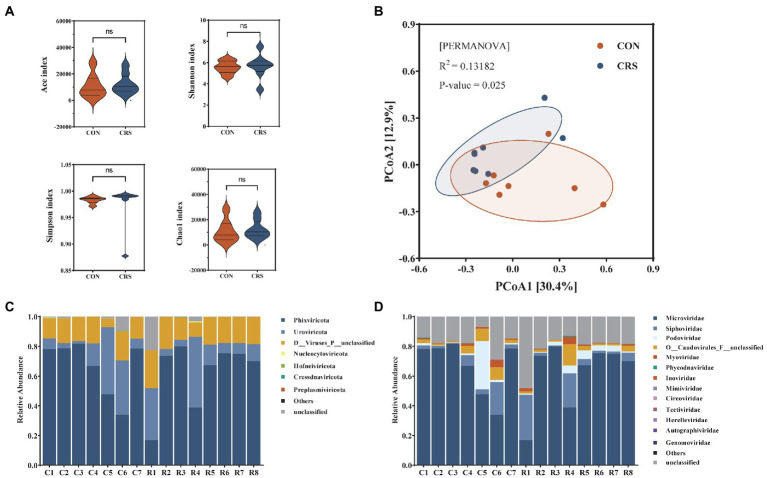
Figure 2.
Comparison of viral community diversity and composition at contigs level between the two groups. (A) Alpha-diversity presented by Ace, Shannon, Simpson, and Chao1 index. No significant differences were detected. (B) Beta diversity visualized using a PCoA plot with Bray–Curtis dissimilarity distances. Compositions of the viral communities at the phylum level (C) and family level (D).

