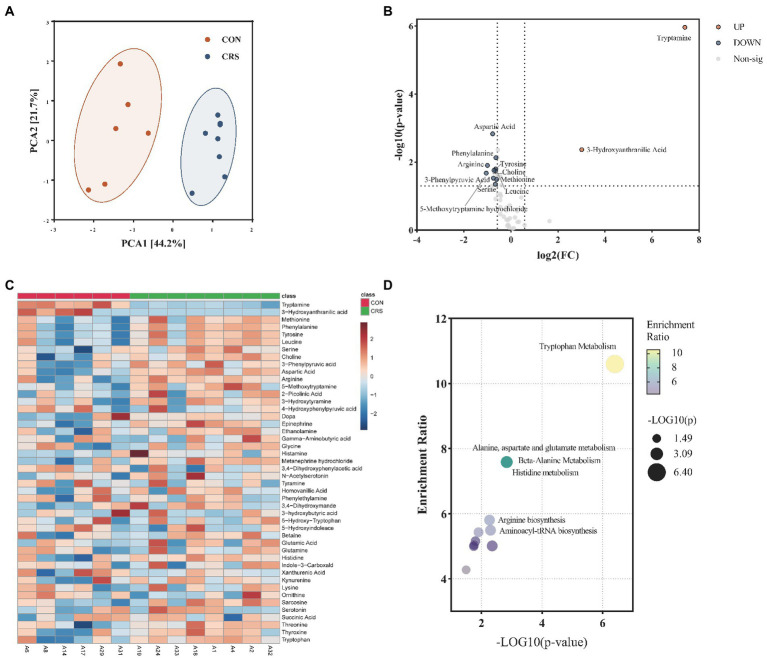
Figure 4.
Characterization of metabolites profile of neurotransmitters from mice fecal. (A) Principal component analysis (PCA) Scores plot between the two groups. The explained variances are shown in brackets. (B) Volcano plot for differential metabolites. Significantly regulated metabolites between groups determined by fold change and value of p (FC>|1.5|, p < 0.05). Red dots represent increased metabolites in CON group; blue dots represent decreased metabolites in CON group. (C) Heatmap of all neurotransmitters; differential metabolites were indicated by an asterisk. (D) Pathway enrichment analysis of differential metabolites.

