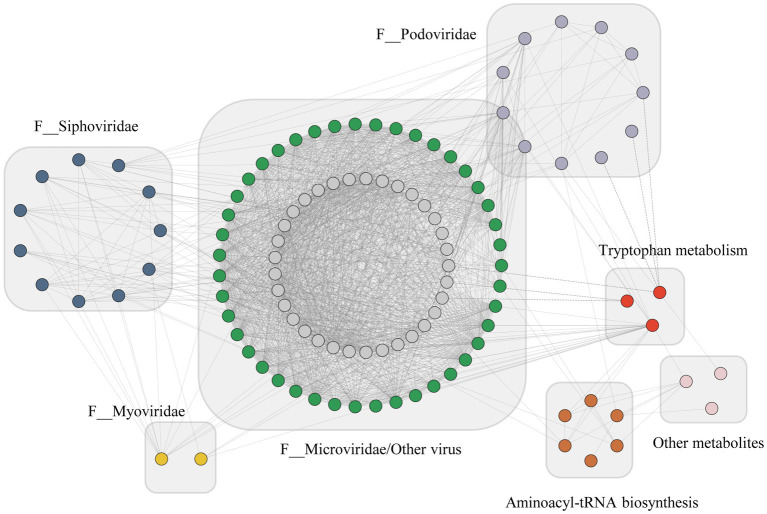
Figure 5.
Co-occurrence network between the differential virome and metabolites with Spearman’s rank correlation coefficient (|r|>0.6, p < 0.01). Viruses were shown in blue, green, yellow, purple, and gray dots and metabolites were shown in red, orange, and pink. Solid lines indicate positive correlations, and dashed lines represent negative correlations.

