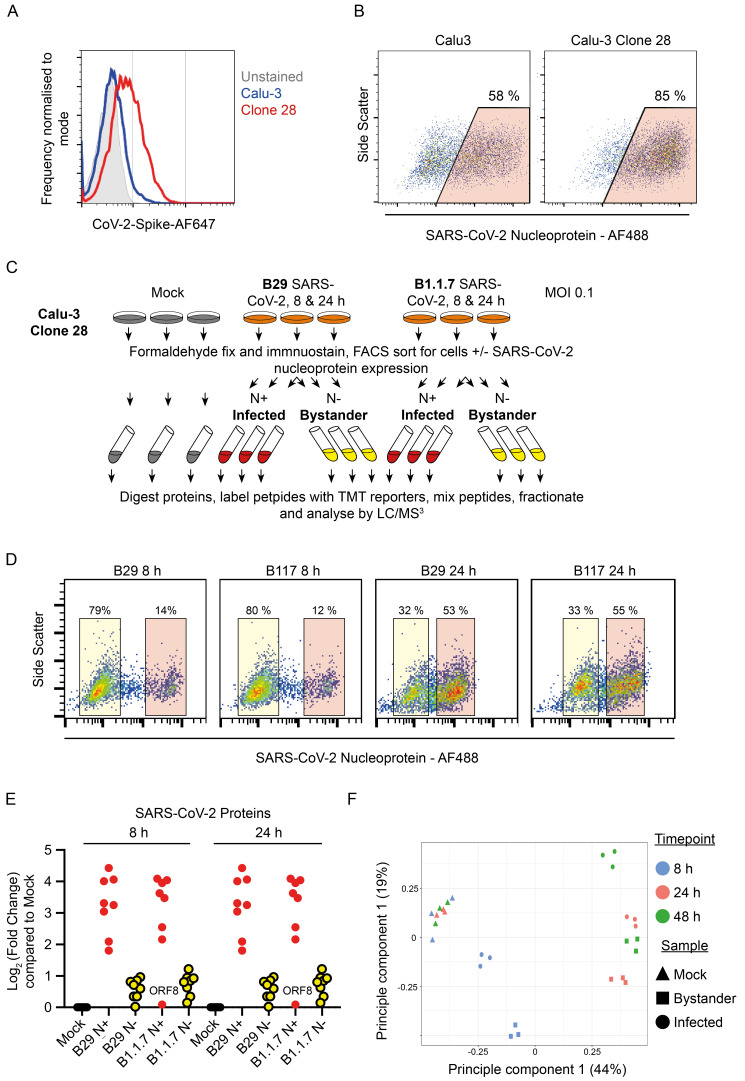
Figure 5. Outline of a multiple time-point SARS-CoV-2 proteomics experiment in an ACE-2 high Calu-3 clone.
( A) Staining for ACE2 using SARS-CoV-2 spike protein on Calu-3 cells and a Calu-3 clone, clone 28, identified with high ACE2 expression. ( B) Example SARS-CoV-2 infection and nucleoprotein staining 24 h after infection of Calu-3 cells or Calu-3 clone 28. ( C) Schematic of the experimental design for proteomic analysis of SARS-CoV-2 infection of Calu-3 cells. ( D) Example flow cytometry from the proteomics experiment described in ( C). ( E) Quantification of SARS-CoV-2 proteins in this proteomics experiment. ( F) Principal component analysis of the conditions included in the Calu-3 proteomics experiments described in Figure 4 and Figure 5.

