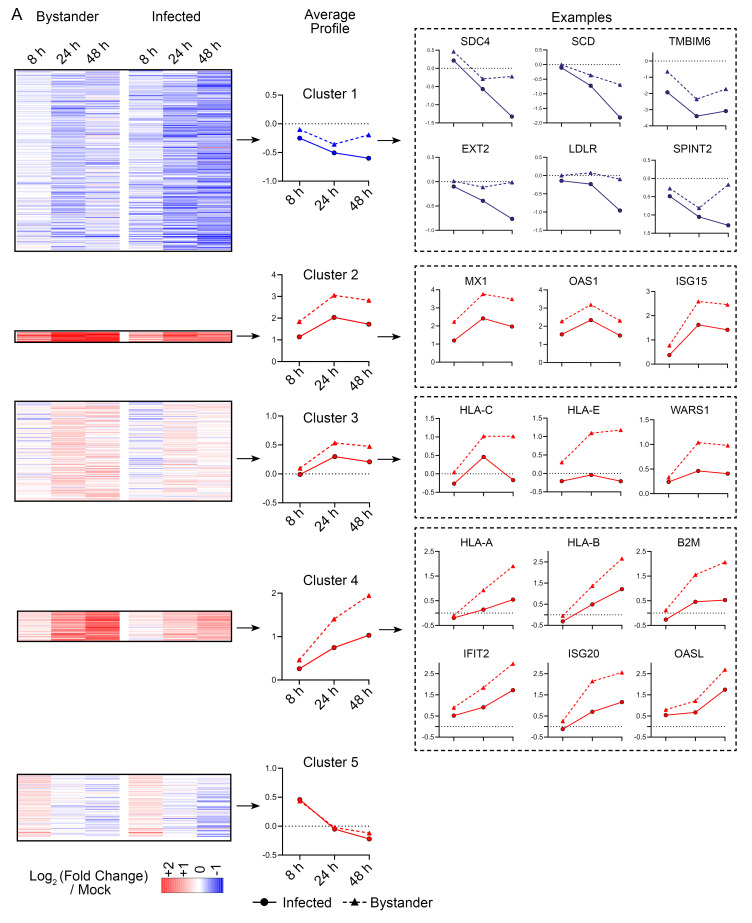
Figure 6. Analysis of proteins altered by SARS-CoV-2 infection of Calu-3 cells.
( A) Left, Heatmap showing the regulation of five clusters of proteins in bystander or infected cells at 8, 24, or 48 h. Data is combined from the two experiments described in Figure 4 and Figure 5. Centre, average time-course profiles of proteins within each cluster. Right, example proteins regulated within each cluster.

