Figure 2.
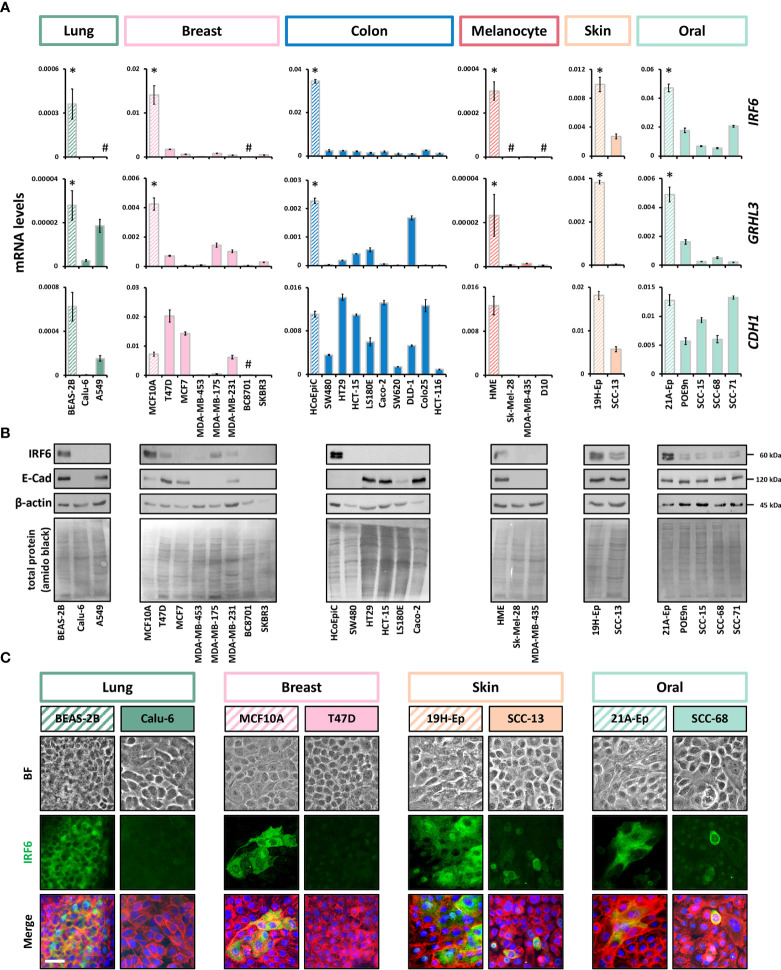
IRF6 and GRHL3 downregulation in cancer cell lines (A) Panels of cancer cell lines and corresponding normal cells (striped boxes) were screened for IRF6, GRHL3, and CDH1. Note that RNA was extracted from all cell cultures at a cell density of approximately 70% confluency kDa, kilo Daltons. * p < 0.05 control vs. cancer cell lines; # not detectable (c T > 32). HME: human melanocytes. (B) Immunoblots for IRF6 and E-Cadherin in a subset of the analyzed cancer cell lines and controls. Full-length blots are shown in Supplementary Figure 6 . HME: human melanocytes. (C) Brightfield (BF) pictures, IRF6 staining, as well as the merge of IRF6 (green) with actin (red) and cell nuclei (blue) is shown for breast and lung cancer, skin and oral SCC samples and their corresponding normal controls. Note that IRF6 is predominantly expressed in the cytoplasm of the various cells. Scale bar: 25 µm.

