Figure 4.

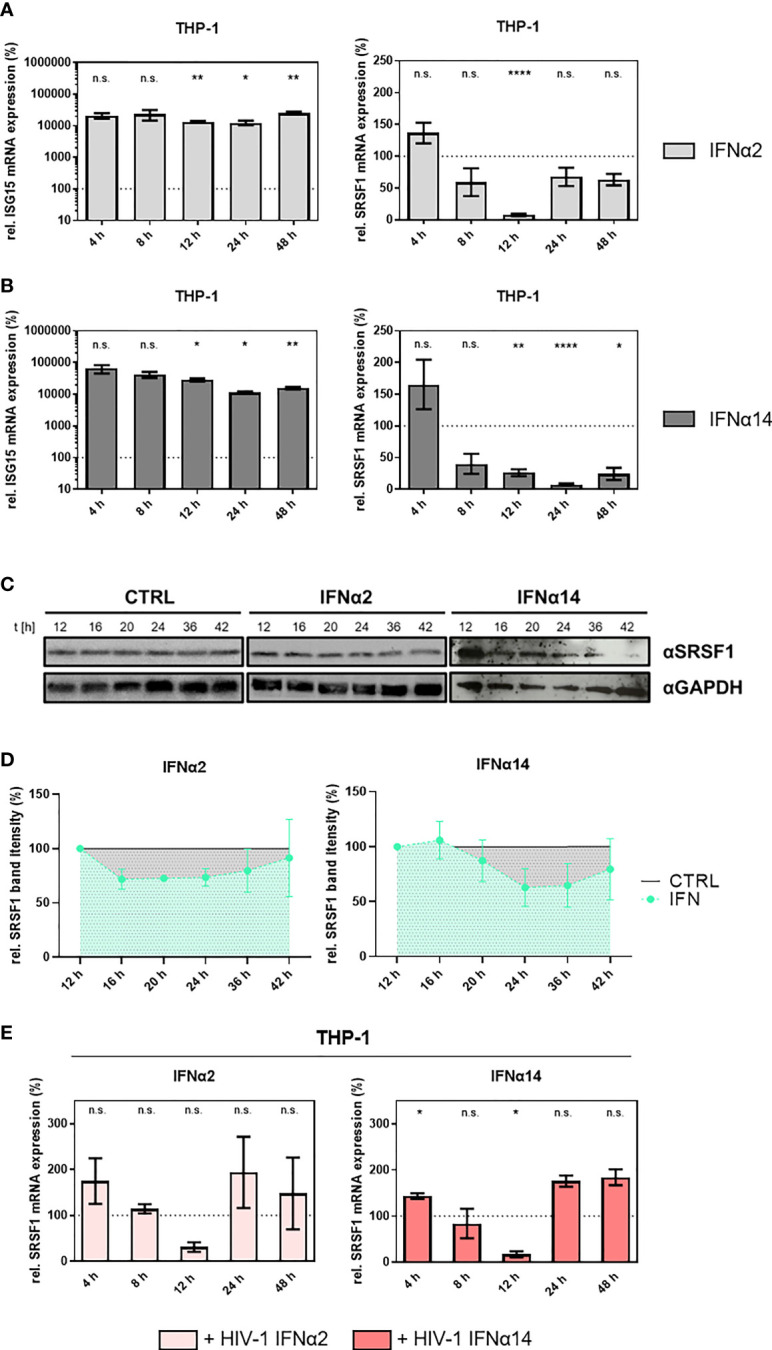
SRSF1 mRNA and protein levels are differentially regulated upon stimulation of macrophages with IFNα2 or IFNα14. Differentiated THP-1 macrophages were treated with IFNα2 (light gray) or IFNα14 (dark gray) (10 ng/ml) over a period of 48 h before cells were harvested and RNA was isolated. Relative mRNA expression levels were measured via RT-qPCR analysis. (A, B) Relative mRNA expression levels of ISG15 and SRSF1 upon stimulation with (A) IFNα2 or (B) IFNα14 in THP-1 cells. Mixed-effects analyses followed by Dunnett’s post-hoc test were used to compare differences between groups at different time points (*p < 0.05, **p < 0.01, ****p < 0.0001 and ns, not significant). (C) Differentiated THP-1 macrophages were treated with IFNα2 or IFNα14 (10 ng/ml) for the indicated amount of time before cells were harvested and proteins were isolated. Proteins were separated by SDS-PAGE, blotted, and analyzed with an antibody specific to SRSF1. A representative Western blot is shown using GAPDH as a loading control. (D) Quantification of multiple Western blots (n = 4 for IFNa14, n = 3 for IFNa2). Total protein amount was stained using Trichloroethanol and used as loading control. Band intensity was measured using ImageJ software. Mixed-effects analyses followed by Dunnett’s post-hoc test. (E) Differentiated THP-1 macrophages were infected with the R5-tropic NL4-3 (AD8) (95) at an MOI of 1. Sixteen hours post-infection, cells were treated with the indicated IFN subtype (10 ng/ml) over a period of 48 h. Cells were harvested at the indicated time points, and RNA was isolated and subjected to RT-qPCR. Relative mRNA expression levels of SRSF1 in THP-1 cells after treatment with IFNα2 or IFNα14 as indicated. GAPDH was used as a house-keeping gene for normalization. Mixed-effects analyses followed by Dunnett’s post-hoc test were used to determine whether the difference between the group of samples reached the level of statistical significance (*p < 0.05, **p < 0.01, ***p < 0.001 and ****p < 0.0001). Mean ( ± SEM) of n = 4 biological replicates is shown.
