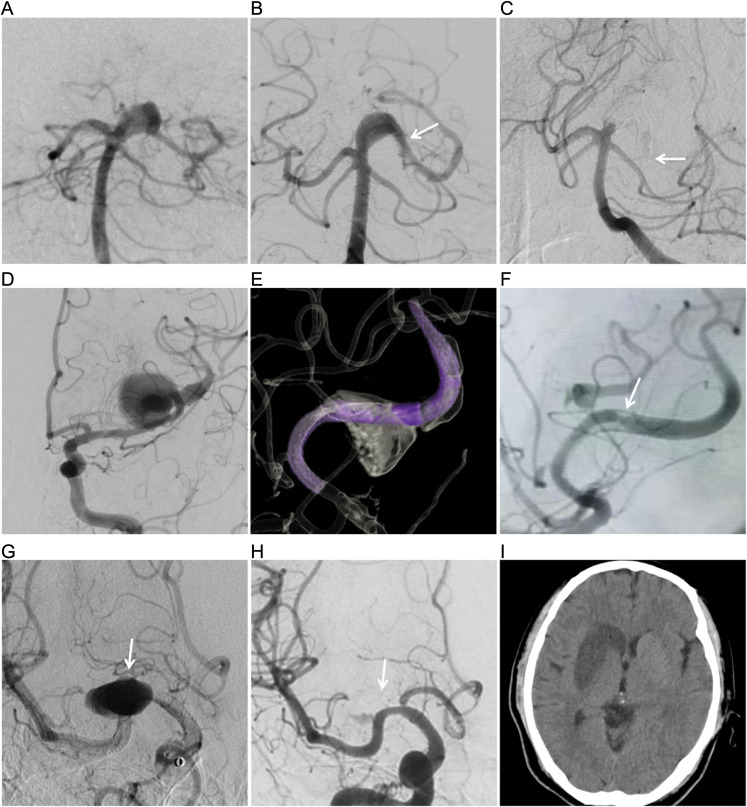
Figure 2.
(A) digital subtraction angiogram (DSA) showing the posterior cerebral artery (PCA) aneurysm. (B) DSA in working position views immediately after flow diversion shows diminished filling of the right PCA dissecting aneurysms. The arrow indicates the distal end of the PED. (C) Six-month DSA follow-up shows parent artery occlusion and contraction distal to the PED. The arrow indicates the distal end of the PED. (D) DSA shows the middle cerebral artery (MCA) dissecting aneurysm. (E) Two PED were partially overlapped in the parent vessel of left MCA dissecting aneurysm. (F) Six-month DSA follow-up shows complete occlusion of the aneurysm and 50% in-stent stenosis (arrow). (G) DSA in AP views immediately after flow diversion shows diminished filling of the aneurysm and the regular filling of lenticulostriate artery (arrow). (H) DSA in AP views 18 h after flow diversion showing disappeared aneurysm and internal lenticulostriate artery (arrow). (I) CT showing new infarct in the right temporal island and basal ganglia three days after the procedure.

