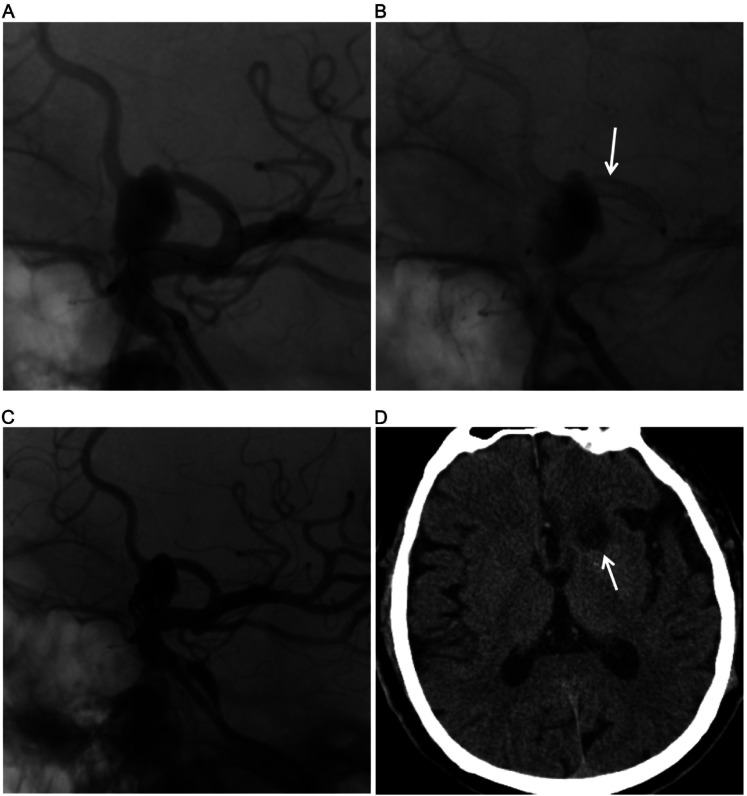
Figure 3.
(A) DSA showing the anterior cerebral artery (ACA) aneurysm. (B) DSA in working position views immediately after flow diversion shows diminished filling of ACA aneurysms (arrow). (C) Loose packing of the aneurysm sac after PED release. (D) CT shows a new infarct in the left basal ganglia and centrum semiovale (arrow).

