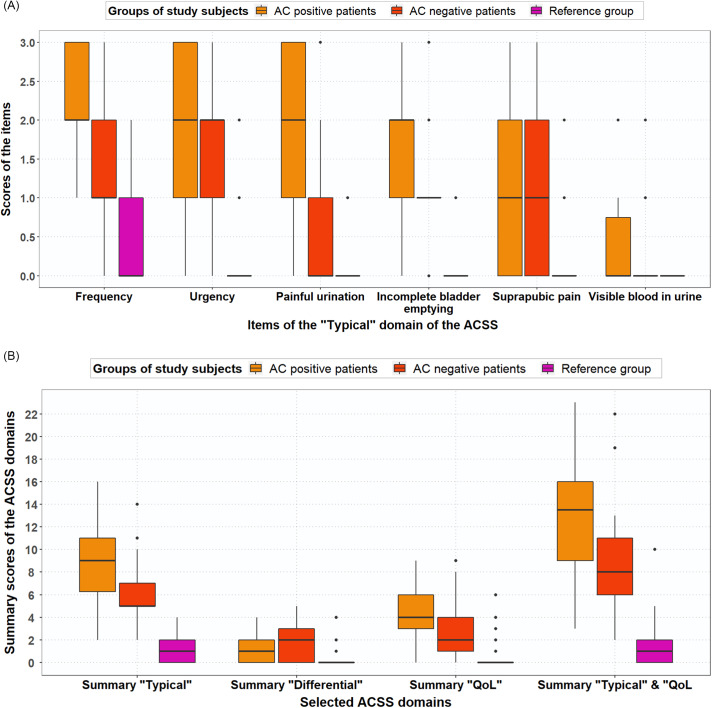
Figure 2.
(A) Boxplot with typical symptom scores (median, IQR) for AC-positive patients (n = 38), AC-negative patients (n = 21) and reference group (n = 70), based on GP guideline diagnosis. (B) Boxplot with ACSS domain scores (median, IQR), both for AC-positive patients (n = 38), AC-negative patients (n = 21) and reference group (n = 70), based on GP guideline diagnosis

