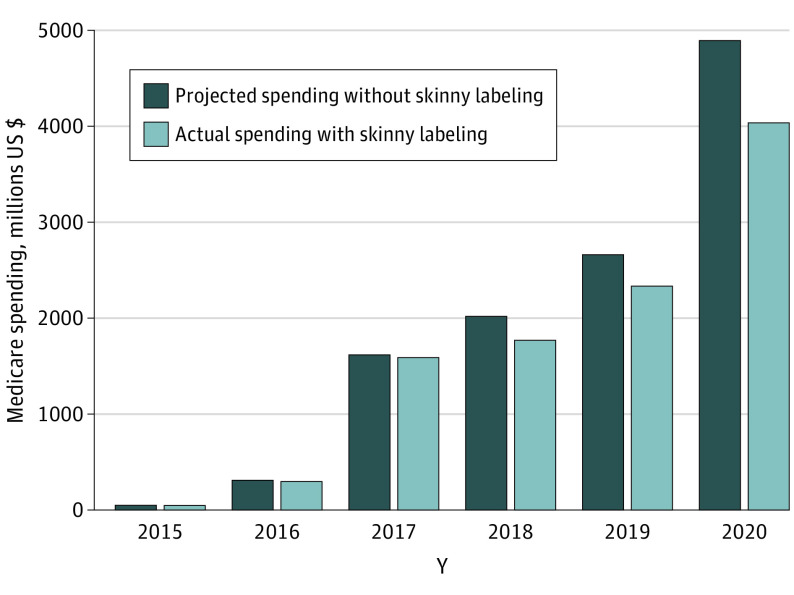
Figure 2. Estimated Medicare Savings From Skinny-Label Biosimilars, 2015 to 2020.
Each light-blue bar represents reported annual Medicare Part B spending on biologics and their skinny-label biosimilars, whereas each dark-blue bar represents estimated annual spending on originator biologics had skinny labeling not been available. The difference between each light-blue and dark-blue bar pair represents annual estimated savings, which increased from $2 million in 2015 to $857 million in 2020 because more biologics experienced skinny-label biosimilar competition and additional skinny-label biosimilars were marketed. Spending was converted to 2021 US dollars using the Consumer Price Index for All Urban Consumers.

