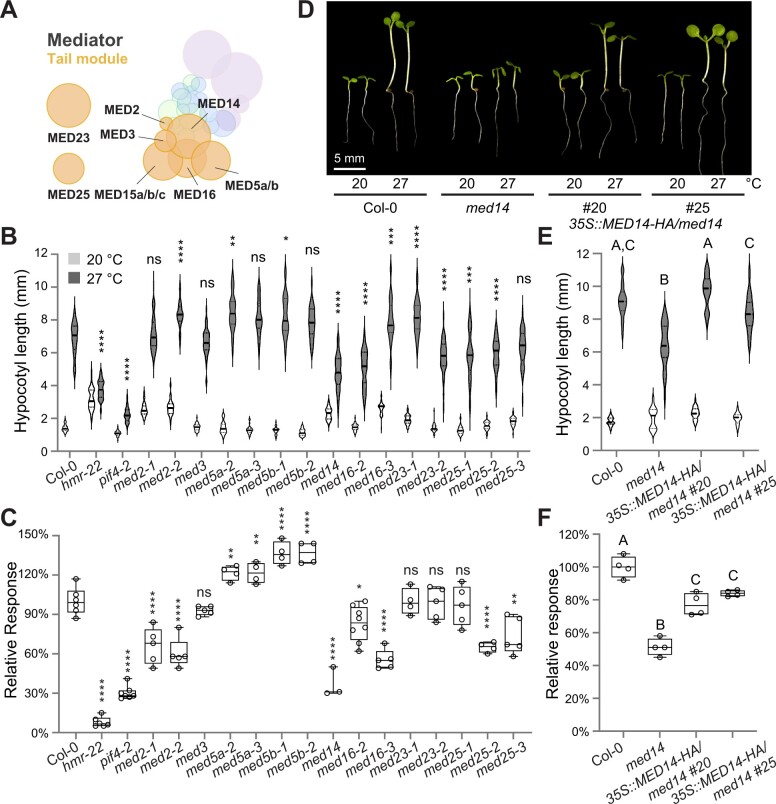
Figure 1.
MED14 is a crucial regulator of thermomorphogenesis. A, Schematic illustration of the Arabidopsis Mediator complex, with an emphasis on components in the tail module. The size of each circle reflects the relative protein size (predicted molecular weight) of each Mediator subunit. The relative position of each Mediator component is based on the cryo-EM and crystal structures of yeast and human Mediator shown by Tsai et al., 2014 and Robinson et al., 2015 and interaction data of Arabidopsis Mediator subunits shown by Maji et al., 2019. Note that the positions of MED23 and MED25 in the tail module are undetermined. Protein subunits in each module are colored in different colors: head module, green; middle module, blue; tail module, orange; cyclin kinase module, purple. See supplemental data for clear compositions of each module. B, Hypocotyl length measurements of mutant seedlings of Mediator tail subunits. Seedlings were grown for 4 days in continuous red (R) light (50 µmol m−2 s−1). The white and grey violin plots represent hypocotyl length measurements at 20°C and 27°C, respectively. The elements of violin plots are as follows: solid line, median; lower dotted line, first quartile; upper dotted line, third quartile. The results of the one-way ANOVA analysis comparing the absolute hypocotyl length between Col-0 and each mutant grown at 27°C are shown (n > 30). ****P < 0.0001; ***P < 0.001; **P < 0.01; *P < 0.05; ns, not significant (P ≥ 0.05). C, Comparison of the relative thermal response among the seedlings in (B). The elements of box plots are as follows: center line, median; box limits, first and third quartiles; whiskers, minimum and maximum values; points, all data points. The relative response is defined as the relative hypocotyl response to 27°C of a mutant compared with that of Col-0 (which is set at 100%). The results of the one-way ANOVA analysis comparing the relative response between Col-0 and each mutant are shown (n ≥ 3). ****P < 0.0001; ***P < 0.001; **P < 0.01; *P < 0.05; ns, not significant (P ≥ 0.05). D, Representative images of 4-d-old Col-0, med14, and 35S::MED14–HA/med14 (#20 and #25) seedlings in continuous R light (50 µmol m−2 s−1) at either 20°C or 27°C. Images of seedlings grown in different conditions were digitally extracted and assembled for easy comparison. All the images were acquired using a Leica MZ10 F modular stereo microscope with the same settings (e.g. light, focus, and magnification). Scale bar, 5 mm. E, Hypocotyl length measurements of seedlings in (D). The elements of violin plots are the same as in (B). Different letters denote significant statistical differences between the absolute hypocotyl length of each line grown at 27°C (one-way ANOVA, n > 30, P < 0.0001). F, Comparison of the relative thermal response among the seedlings in (D). The elements of box plots are the same as in (C). Different letters denote significant statistical differences between the relative response of each line (one-way ANOVA, n ≥ 4, P < 0.0001).

