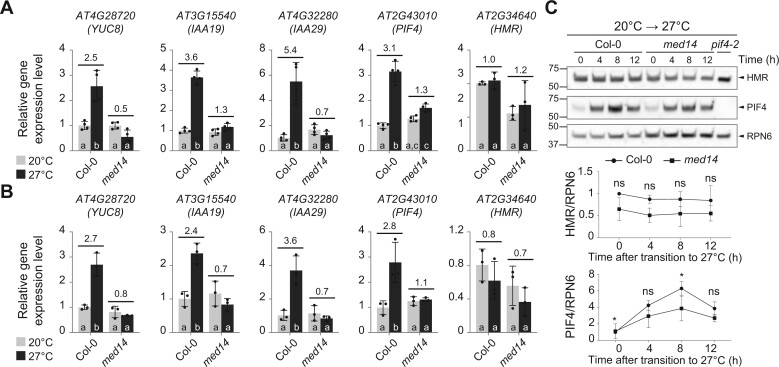
Figure 2.
MED14 is required for the thermo-induced expression of PIF4 target genes. A, RT–qPCR analysis of the steady-state transcript levels of YUC8, IAA19, IAA29, PIF4, and HMR in Col-0 and med14 seedlings grown in continuous red (R) light (50 µmol m−2 s−1) for 96 h at 20°C and 27°C. Different lowercase letters at the bottom of bars denote significant statistical differences between the relative gene expression level (two-way ANOVA with Tukey HSD, n = 4 or 3, P < 0.001 for YUC8, IAA29, P < 0.0001 for IAA19, P < 0.01 for PIF4, and P < 0.05 for HMR). Numbers indicate the fold changes between transcript levels at these two temperatures. Error bars represent the sd of three or four biological replicates. B, RT–qPCR analysis of the steady-state transcript levels of YUC8, IAA19, IAA29, PIF4, and HMR in Col-0 and med14 during the 21°C–27°C transitions. Seedlings were grown in continuous R light (50 µmol m−2 s−1) for 96 h and then transferred to 27°C in the same light condition. Samples were taken before (light gray) and 6 h after (dark gray) the 27°C treatment. Different lowercase letters at the bottom of bars denote significant statistical differences between the relative gene expression level (two-way ANOVA with Tukey HSD, n = 3, P < 0.001 for YUC8, P < 0.01 for IAA19, IAA29, P < 0.05 for PIF4, and not significant for HMR). Fold changes in the transcript levels by the 27°C treatment are shown above the columns. In both (A) and (B), PP2A was used as an internal control. For each gene, the transcript level in Col-0 at 20°C was set to 1, and others were calculated by the 2−ΔΔCt method. Error bars represent the sd of three or four biological replicates. C, Immunoblot analysis of HMR and PIF4 levels in Col-0 and med14 during the 20°C–27°C transitions. Seedlings were grown in continuous R light (50 µmol m−2 s−1) for 96 h and then transferred to 27°C in the same light condition. Samples were collected and analyzed at the indicated time points. RPN6 was used as a loading control. The relative levels of HMR and PIF4, normalized to RPN6, are shown underneath the immunoblots. The normalized level (HMR/RPN6 or PIF4/RPN6) in Col-0 at 20°C before transition (time 0 h) was set to 1 and others were calculated as relative levels. The results of the Student’s t test analysis are shown (n = 4). *P < 0.05; ns, not significant (P ≥ 0.05). The immunoblots of all four biological replicates are shown in supplemental data.

