Figure 1.
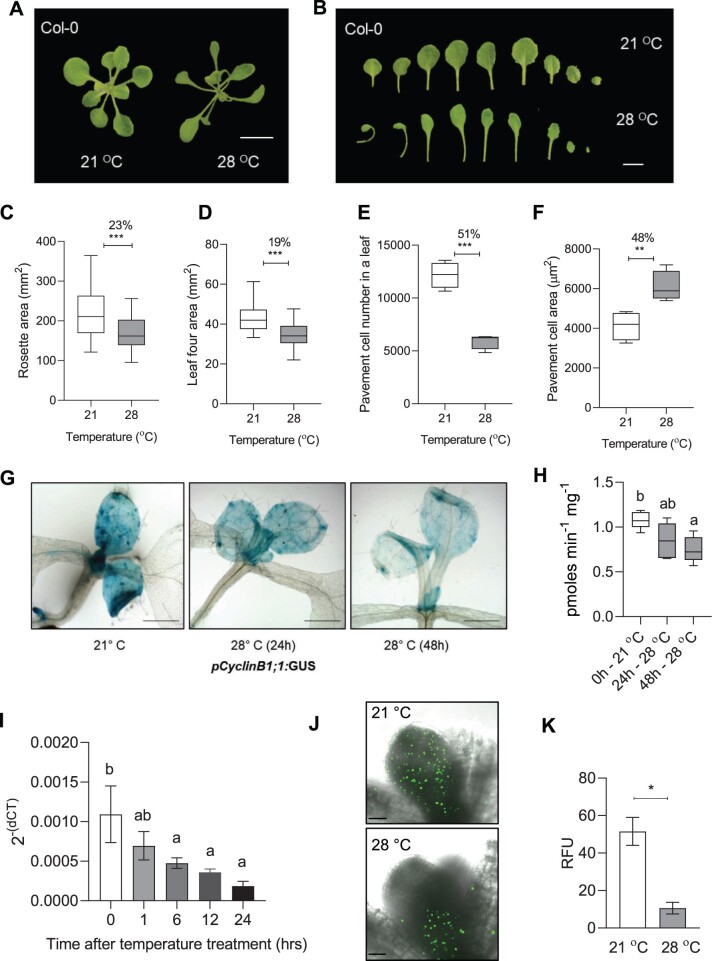
High temperature reduces leaf area by controlling cell number in the Arabidopsis leaves. A, Rosette picture and (B) leaf series of 21°C and 28°C grown Arabidopsis Col-0 wild-type plants at 20 DAS. The images were digitally extracted for size comparison. Scale = 1 cm. C–F, Quantification of rosette area (n = 80–100, C), leaf four area (n = 19–23, D), average pavement cell number on the abaxial side of leaf four (n = 4 leaves, E), and average pavement cell area (n = 4 leaves, F) in Col-0 plants grown at 21°C and 28°C at 20 DAS. Box plot extends from 25th to 75th percentiles, where the center line represents the median and whiskers minimum and maximum values. Percent change is indicated above the graphs. G and H, Images showing GUS staining (G) and its quantification (n = 6, H) in pCyclinB1;1:GUS reporter line at 21°C and 28°C. Scale = 1 cm. Box plot extends from 25th to 75th percentiles, where the center line represents the median and whiskers minimum and maximum values. I, Transcript levels of CyclinB1;1 in the proliferating leaves in Col-0 at different time points after high-temperature (28°C) treatment presented as 2-(dCt) values. Values represent mean ± se (n = 3). J, EdU fluorescence showing the distribution of mitotic cells in 5-day-old Col-0 leaf grown at 21°C or 28°C. Scale = 50 µm. K, Quantification of fluorescent intensity in EdU-treated Col-0 leaves. RFU = relative fluorescent unit (arbitrary). Values represent mean ± se (n = 3). Stars in C–F and K indicate Student’s t test ***P< 0.001, **P < 0.01, *P< 0.05. Letters indicate statistically significant difference between treatments (H) or the time points (I) based on one-way ANOVA and Tukey’s test, P < 0.05.

