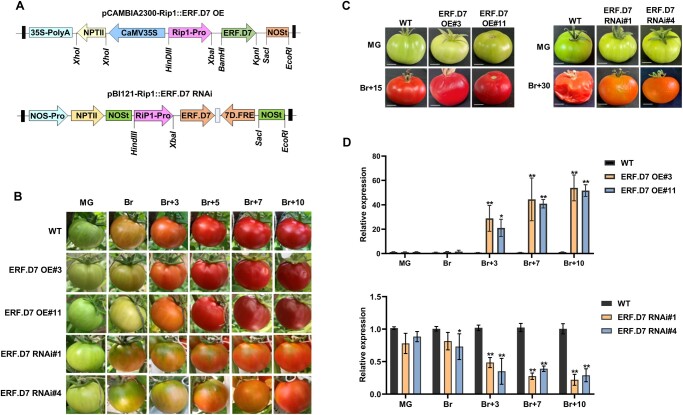
Figure 3.
Morphological and molecular characterization of SlERF.D7 OE and RNAi lines. A, Vector diagram of pCAMBIA2300-Rip1::SlERF.D7 OE (over-expression) and pBI121-Rip1::SlERF.D7 RNAi (silencing) construct. B, Phenotypic analysis of WT, SlERF.D7 OE, and RNAi line fruits at MG, Br, 3-day after Br (Br+3), 5-day after Br (Br+5), and 7-day after Br (Br+7). C, Off-vine phenotypic assessment of WT, SlERF.D7 OE, and RNAi line fruits harvested at the MG stage and photographed till the first sign of shriveling appears, 15-day post Br (Br+15) in SlERF.D7 OE lines, and 30-day post Br (Br+30) in SlERF.D7 RNAi line. D, Transcript levels of SlERF.D7 in WT, OE, and RNAi transgenic fruit analyzed at MG, Br, 3-day after Br (Br+3), 7-day after Br (Br+7), and 10-day after Br (Br+10) by RT-qPCR with Actin gene as an internal control. Error bars mean±sd of three biological replicates. Asterisks indicate the statistical significance using Student’s t test: *, 0.01 < P-value < 0.05; **, 0.001 < P-value < 0.01.

